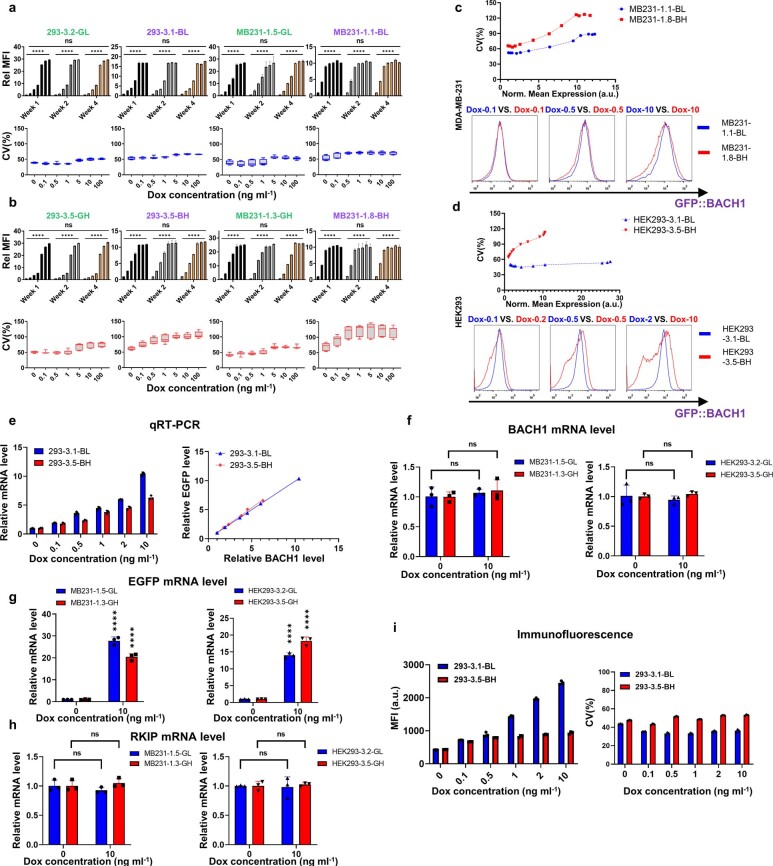
Extended Data Fig. 3. Reproducibility of inducible expression and BACH1-dependent downstream target changes and mean-noise decoupling in selected clones.
(a),(b) Dose-responses of mean fluorescence intensity (MFI) and CV at 0, 0.1, 0.5, 1, 5, 10, 100 ng ml−1 Dox concentrations over 4 weeks in low-noise (a) and high-noise (b) 293 and MB231 clones, respectively. Relative mean fluorescence intensity (Rel MFI) (Top) of each individual replicate of each clone was calculated via normalization to a single replicate at 0 ng ml−1 Dox concentration in the first week. Two-way ANOVA was performed to compare the differences between doses and time points. All time point comparisons had P-values over 0.5 and comparisons between doses had P-values below 0.0001, n = 3. Coefficient of variation (CV) (Bottom) of each clone at every dose condition was calculated from 3 independent measurements at first, second and fourth week with total 9 replicates pooled together. Two-tailed Mann Whitney test was performed to compare the CV differences between corresponding low- and high-noise clones at every dose. MB231-1.1-BL versus MB231-1.8-BH had a P-value of 0.0111 and MB231-1.5-GL versus MB231-1.3-GH had a P-value below 0.0111. 293-3.1-BL versus 293-3.5-BH had a P-value of 0.0041 and 293-3.2-GL versus 293-3.5-GH had a P-value below 0.0111, n = 9. For box-plot, center line represents the median and whiskers is from minimum to maximum. (c)(d) Plotting the noise (CV) as a function of normalized mean gene expression for both low- and high-noise clones of MB231 (c) and 293 (d) cells revealed broad decoupled noise regimes (Top) where the CVs differ while the means are similar. Gene expression profile comparison between two clones at representative decoupled noise points (Bottom). (e) Left panel: BACH1 mRNA level dose-responses of both low-noise mNF-BACH1 (BL) and high-noise mNF-BACH1 (BH) 293 clones. Relative mRNA levels were calculated between each individual replicate and the corresponding uninduced control (n = 3). Right panel: Correlation between BACH1 and GFP mRNA levels in mNF-BACH1 clones (linear regression slopes of 0.9613 and 1.070 for 293-3.1-BL and 293-3.5-BH, respectively; R-square goodness of fit values of 0.9999, 0.9959 for 293-3-BL, BH, respectively). (f) (g) (h) BACH1, eGFP and RKIP mRNA expression in low- and high-noise mNF-GFP clones of both MB231 (left) and 293 (right) cells, unpaired two-tailed t-test, n = 3, P > 0.05. (i) Left panel: Protein-level dose-responses of total (endogenous + ectopic) BACH1 protein in both low-noise mNF-BACH1 (BL) and high-noise mNF-BACH1 (BH) 293 clones (n = 3). Right panel: Total BACH1 protein level noise assessed from immunofluorescence measurements for both low-noise mNF-BACH1 (BL) and high-noise mNF-BACH1 (BH) 293 clones (n = 3).

