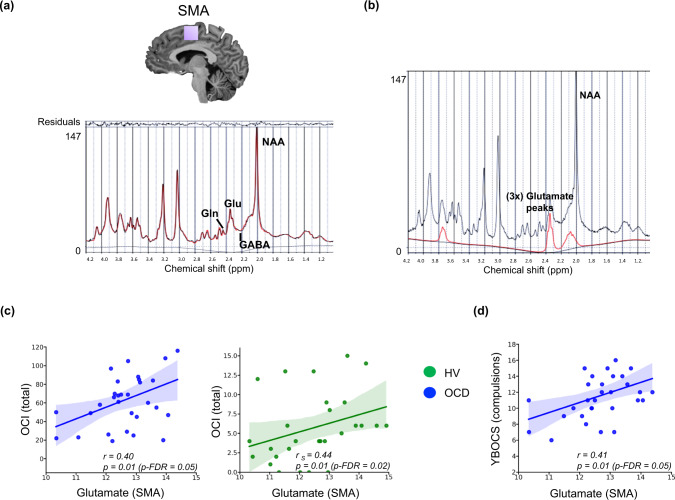
Fig. 2. Relationships between compulsivity and Glu levels in SMA.
a Shows the LCModel analysis of in vivo 1H MR spectra acquired from a healthy participant at 7T (semi-LASER, echo time/repetition time = 26/5000 ms, from a 20 × 20 × 20 mm voxel placed bilaterally at supplementary and pre-supplementary motor areas, located at medial portion of Brodmann area 6), b presents the fitted model for Glu, in red, while the acquired spectrum is plotted in black. c Demonstrates the relationships between Glu levels in SMA and obsessive-compulsive symptoms as measured with the self-administered OCI scale in the individuals with OCD and in healthy subjects (OCI was missing for 2 HV’s), while d depicts the relationship between the clinician rated YBOCS scores and Glu levels in SMA in the OCD group. The blue colour represents OCD patients, whereas green depicts the data for healthy subjects. The line of best fit is shown with the 95% confidence intervals for the regression estimate in translucent bands around the regression lines (for all figures in c and d). For figure c the sample size for the OCD subjects was (n = 30) and for the HV group it was (n = 29), for figure d the OCD sample size was (n = 31). All relationships were studies using a two-tailed Pearson test. The data for this figure are provided in the Source Data file. Acronyms: SMA supplementary motor area, GABA γ-amino-butyric acid, Glu glutamate, Gln glutamine, NAA N-acetylaspartate, ppm parts per million, r Pearson’s r correlation coefficient, r s Spearman’s rank correlation coefficient, p-FDR p-value corrected for False Discovery Rates98, OCI Obsessive Compulsive Inventory, YBOCS Yale Brown Obsessive Compulsive Scale, HV healthy volunteers, OCD obsessive-compulsive disorder.

