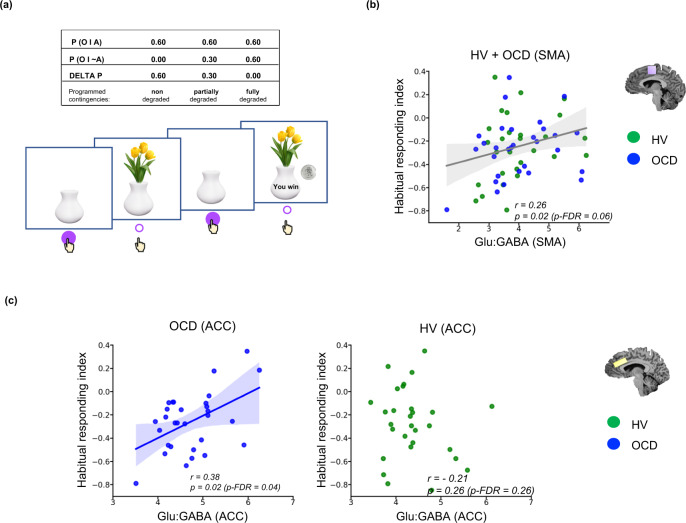
Fig. 3. Relationship between habitual responding as measured with the contingency degradation task and Glu:GABA ratios in ACC and SMA.
a Depicts the stimuli from the contingency degradation task31 and its task design. Participants are shown a white empty vase on the screen, which fills with flowers when participants press the space bar, and which has a 60% chance of being associated with winning 20 pence. On degraded trials, this 60% positive contingency is reduced to 0% (full degradation) or 30% (partial degradation), by non-response contingent presentations of reward. b Shows the positive relationship between an index of habitual responding, the difference between full and non-degraded conditions (higher means a bias towards habitual control) and Glu:GABA ratio in SMA of the entire sample of OCD and healthy volunteers (the grey fitted line). c Shows the positive relationship between the index of habitual responding and the anterior cingulate cortex for each group separately. The blue colour represents OCD patients, whereas green depicts the data for healthy subjects. The line of best fit is shown with the 95% confidence intervals for the regression estimate in translucent bands around the regression lines. For figure b the total sample size was (n = 59): 30 OCD and 29 healthy participants. For figure c the sample size for the OCD group was (n = 30) and in HV (n = 30). All relationships were studied using a two-tailed Pearson test. The data for this figure are provided in the Source Data file. Acronyms: SMA supplementary motor area, ACC anterior cingulate cortex, GABA γ-amino-butyric acid, Glu glutamate, r Pearson’s r correlation coefficient, p-FDR p-value corrected for False Discovery Rates98, O outcome, P probability, HV healthy volunteers, OCD obsessive-compulsive disorder.

