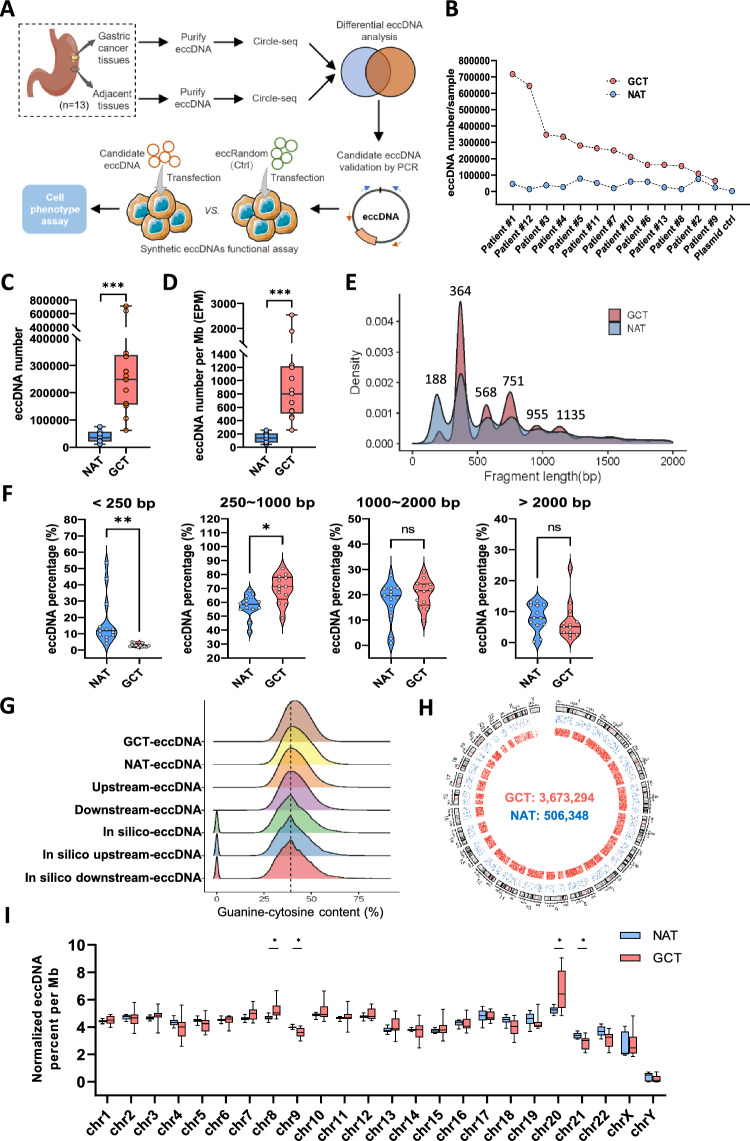
Fig. 1.
Hallmarks of eccDNA profile in gastric cancer. A Workflow of the study. B The absolute eccDNA number in the paired samples of gastric cancer patients. C GCT group contained significantly more eccDNAs than that of NAT group. D The eccDNA count per million reads mapped (EPM) of GCT group was significantly higher than that of NAT group. E Length distibutions of GCT- and NAT-eccDNAs. F Comparision of eccDNA within different length-intervals between NAT and GCT groups. G Guanine-cytosine content distribution of GCT, NAT, in silico eccDNAs and their upstream and downstream regions with equivalent length. H The genome-wide scale distributions of GCT- and NAT-eccDNAs (pool of 13 samples for each group). The red and blue dots represent the GCT derived and NAT derived eccDNAs, respectively. I The normalized eccDNA density (percentage of eccDNA EPM) in 24 chromosomes of GCT and NAT group

