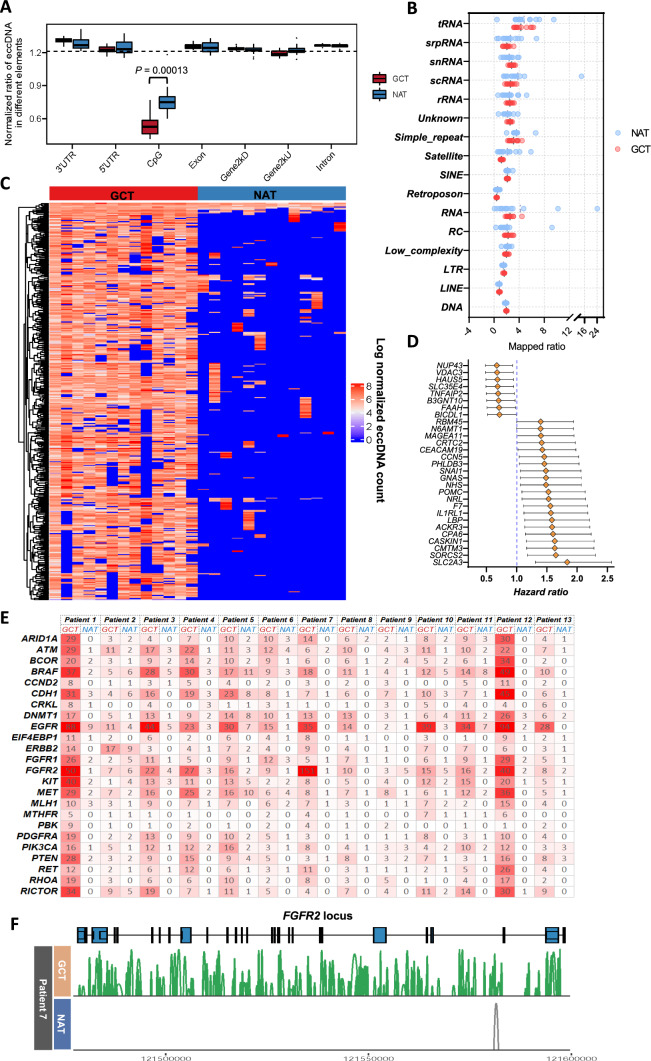
Fig. 2.
Genomic annotation of eccDNAs in GC and analysis of eccGenes. A Distribution of GCT- and NAT-eccDNAs in the indicated genomic regions. B Normalized eccDNA reads ratio mapped in specific repetitive genomic elements (median, short black line) C Heatmap represents the GCT differential genes with high eccDNA generation frequency compared with NAT. One row indicates one specific gene and the column indicates one sample. D GC prognosis-associated genes among the GCT-differential genes with high eccDNA-generation frequency. Good prognosis genes: hazard ratio < 1.0; Poor prognosis genes: hazard ratio > 1.0. E Copy number counts of eccDNAs derived from GC-related driver genes in the 13 individual patients. F The eccDNA browser track at the FGFR2 gene locus in both GCT and NAT of patient #7. The connection lines represent the structure of eccDNAs detected in either GCT or NAT

