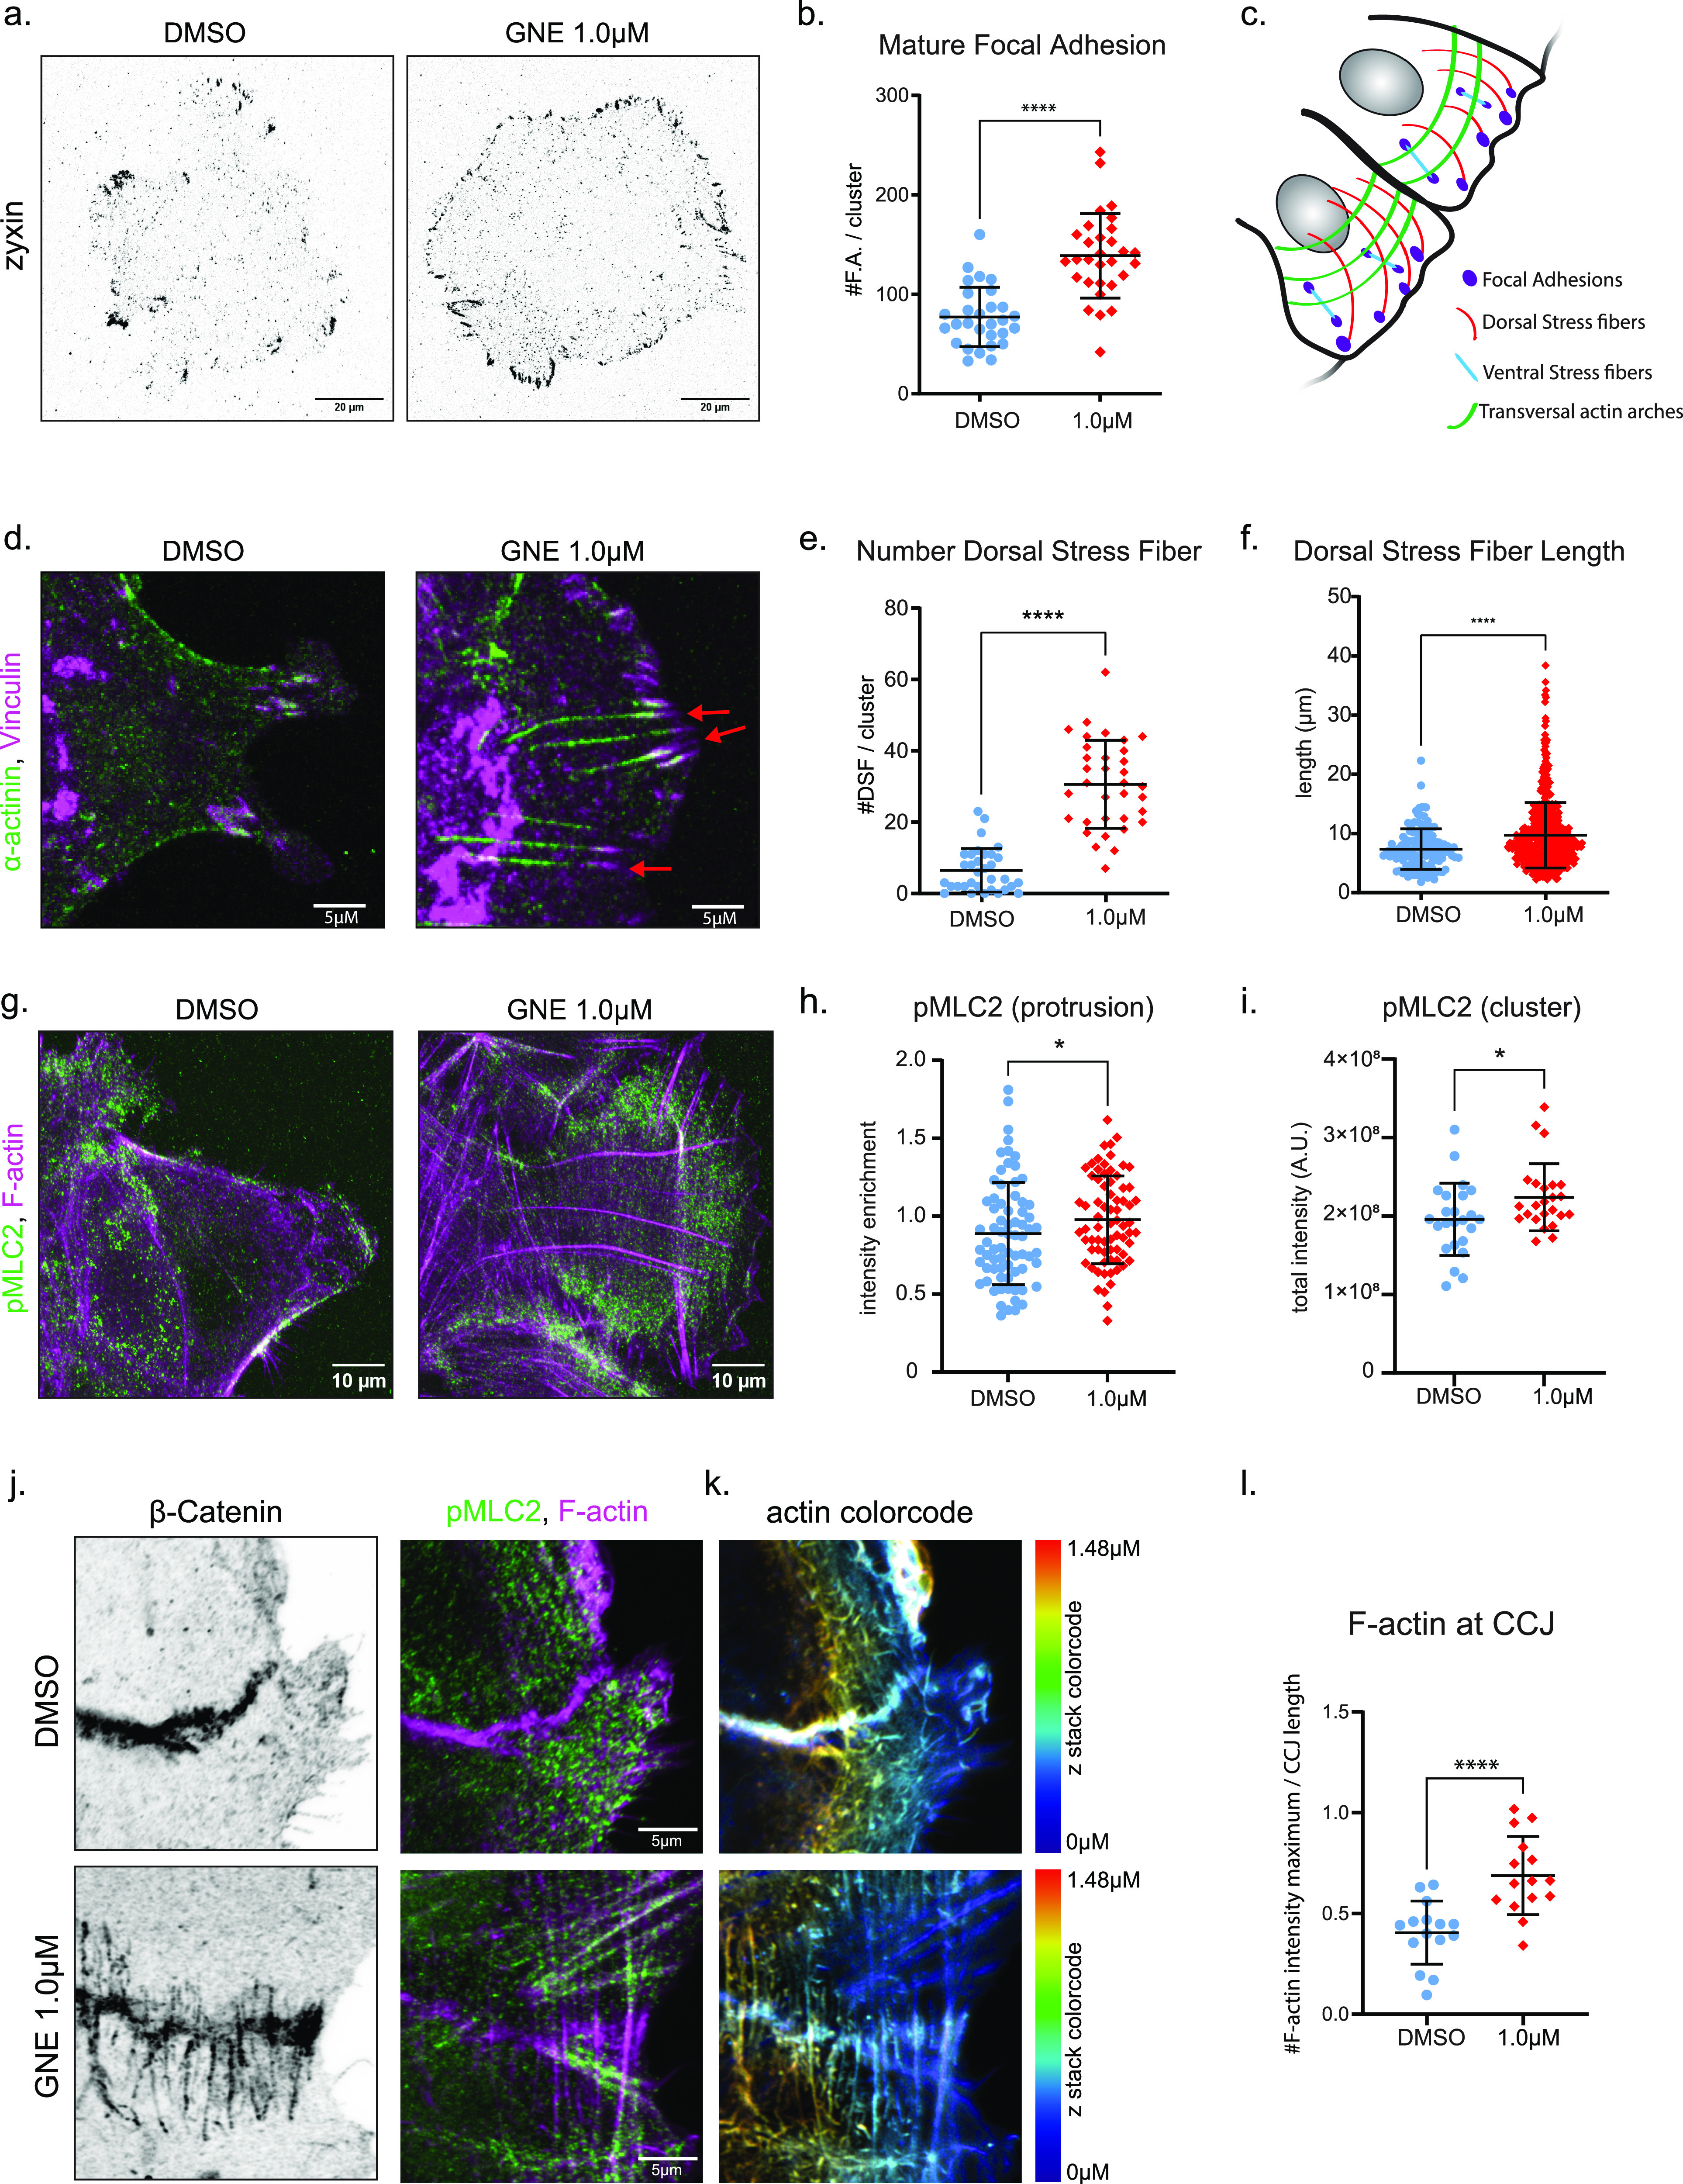
Figure 2. MAP4K4 loss of function stabilizes focal adhesions and increases F-actin bundles.

(A) Representative confocal images of A431 clusters treated with DMSO or GNE-495 at 1.0 μM stained for zyxin, a mature focal adhesion marker. (B) Number of zyxin-positive focal adhesions on clusters treated with DMSO or GNE-495 at 1.0 μM. At least eight clusters per experiment, from three independent experiments were analyzed. (C) Schematic representation of the different types of stress fibers. (D) Confocal z-scan projection of representative cell protrusion treated with DMSO or GNE-495 at 1.0 μM and stained for α-actinin (green) and vinculin (magenta). Arrows indicate F-actin fibers enriched in α-actinin that elongates from focal adhesions towards the dorsal part of the cluster, the so-called dorsal stress fibers. (E) Number of dorsal stress fibers per cluster treated with DMSO or GNE-495 at 1.0 μM. At least 30 clusters from three independent experiments were analyzed. (F) Length of dorsal stress fibers of clusters treated with DMSO or GNE-495 at 1.0 μM. All the dorsal stress fibers of at least eight clusters per experiment from three independent experiments were measured. (G) Confocal z-scan projection of representative cell protrusion treated with DMSO or GNE-495 at 1.0 μM and stained for F-actin (magenta) and pMLC2 (green), showing the differences in pMLC2 accumulation in DMSO or after GNE-495 treatment at 1.0 μM. (H) Ratio of the mean intensity of pMLC2 at protrusions over the mean intensity of pMLC2 at entire cluster. At least three protrusion per cluster, from eight clusters per experiments of three independent experiments were analyzed. (I) Quantification of total pMLC2 intensity in DMSO or after GNE-495 treatment. At least 24 clusters from three independent experiments were analyzed. (J) Confocal z-scan projection of representative cell–cell junction treated with DMSO or GNE-495 at 1.0 μM and stained for β-catenin, pMLC2, and F-actin, showing the perpendicular organization of F-actin relative to the junction orientation after GNE-495 treatment. pMLC2 is accumulated at the thick F-actin after GNE-495 treatment. (K) F-actin staining color coded by the position in the z-axis, showing accumulation of perpendicular thick F-actin along all the junction after GNE-495 treatment, including the more dorsal parts, indicated by the accumulation of filaments in yellow and red. (L) Relative abundance of perpendicular F-actin bundles along the cell–cell junction side of clusters treated with DMSO or GNE-495 at 1.0 μM, calculated as described in the Materials and Methods section. Around 15 cell–cell junctions from different cluster, from three independent experiments were analyzed. All the data are presented as mean ± s.d. and tested by Kruskal–Wallis (*P < 0.05, **P < 0.01, ***P < 0.001, ****P < 0.0001).
