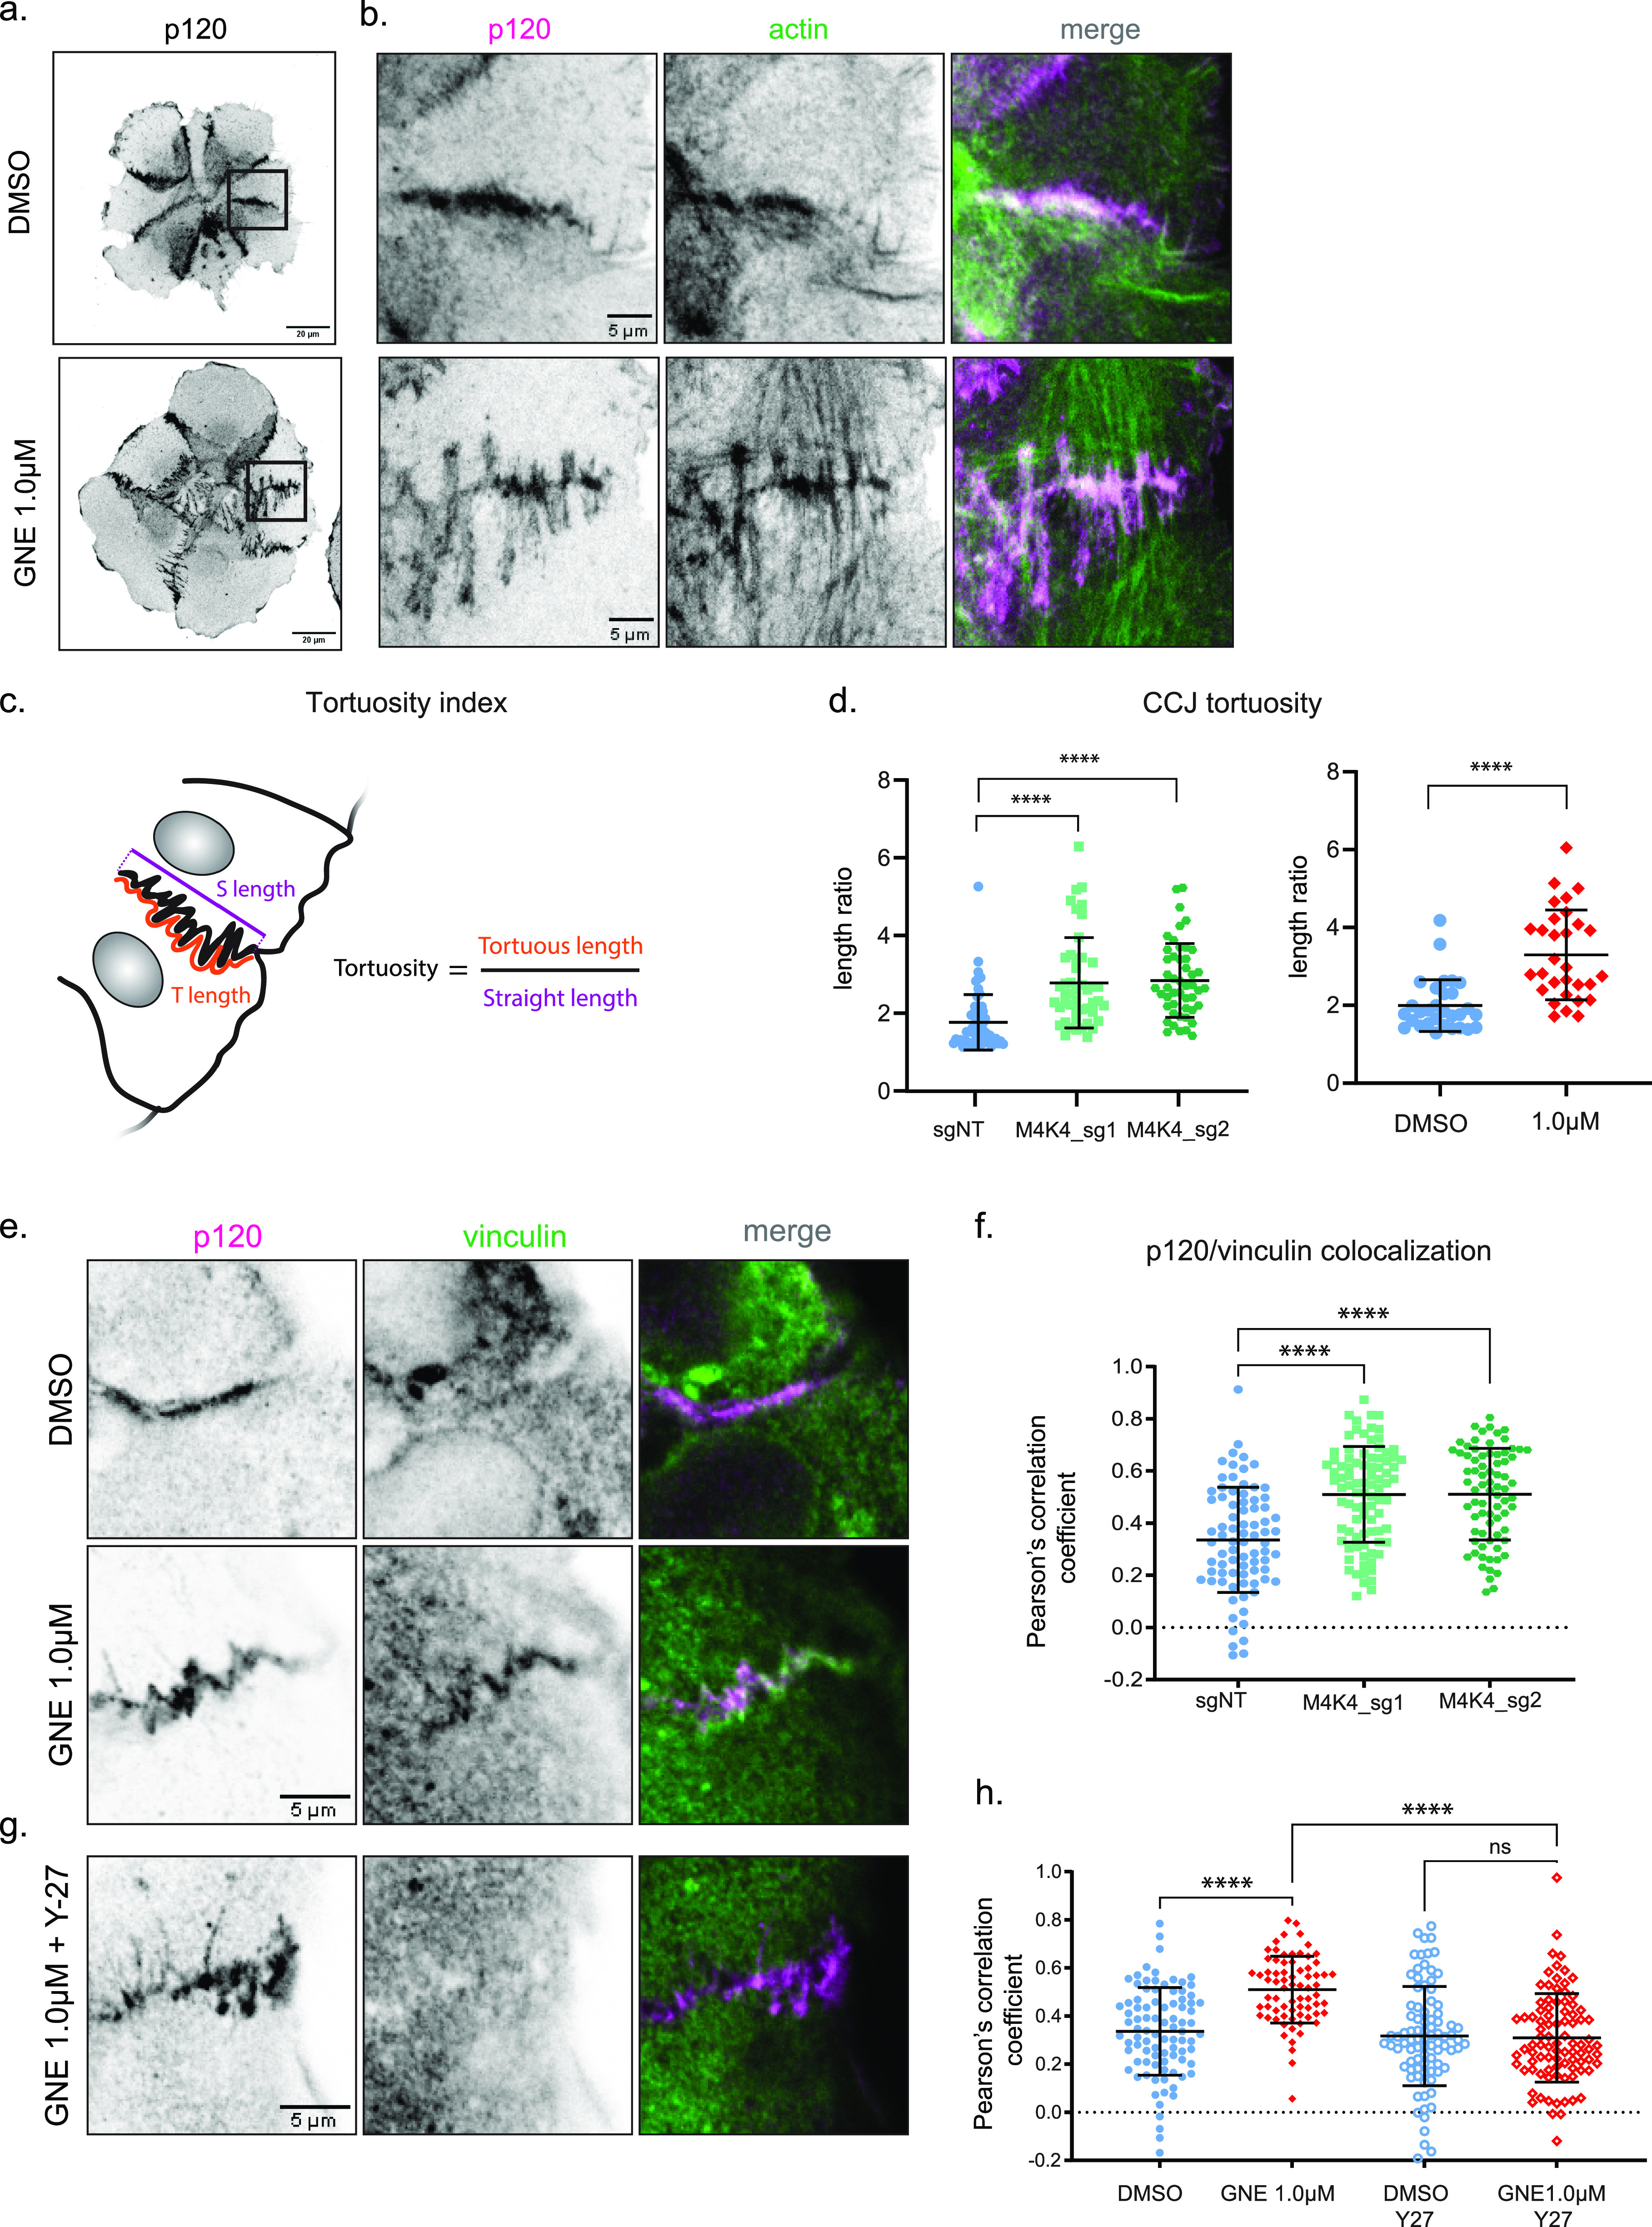
Figure 4. MAP4K4 loss of function increases tension loading at cell–cell junctions.

(A) z-scan projection of representative confocal images of p120-catenin stained A431 clusters, showing the differences in the cell–cell junction morphology of clusters treated with DMSO or GNE-495 at 1.0 μM. (B) Crops of the previous images, indicating parallel or perpendicular F-actin organization at the adherens junction. (C, D) Schematic representation of cell–cell junction tortuosity index calculation (D) Cell–cell junction tortuosity index for A431 clusters control (sgNT) or KO for MAP4K4, or treated with DMSO or GNE-495 at 1.0 μM. At least three junctions of five different clusters per experiment, from three independent experiments were analyzed. (E) Representative confocal images of cell–cell junctions, showing vinculin accumulation at junctions of clusters treated with DMSO or GNE-495 at 1.0 μM. (F) Colocalization between p120 and vinculin intensities for clusters control (sgNT) or KO for MAP4K4, calculated by the Pearson’s correlation coefficient. At least three junctions per cluster, from at least eight clusters per experiment, from three independent experiments were analyzed. (G) Representative confocal images of cell–cell junctions, showing loss of vinculin accumulation at junctions when GNE-495–treated clusters for 24 h were exposed to the ROCK inhibitor Y-27632 during 15 min. (H) Colocalization between p120 and vinculin in clusters treated with DMSO or GNE-495 at 1.0 μM alone or in combination with Y-27632 (2.5 μM), calculated by the Pearson’s correlation coefficient. At least three junctions per cluster, from at least eight cluster per experiment, from three independent experiments were analyzed. Data on (D) are represented as mean ± s.d. and tested by Mann–Whitney test. Data on (F, H) are represented as mean ± s.d. and tested by Kruskal–Wallis test. (ns, nonsignificant; *P < 0.05, **P < 0.01, ***P < 0.001, ****P < 0.0001).
