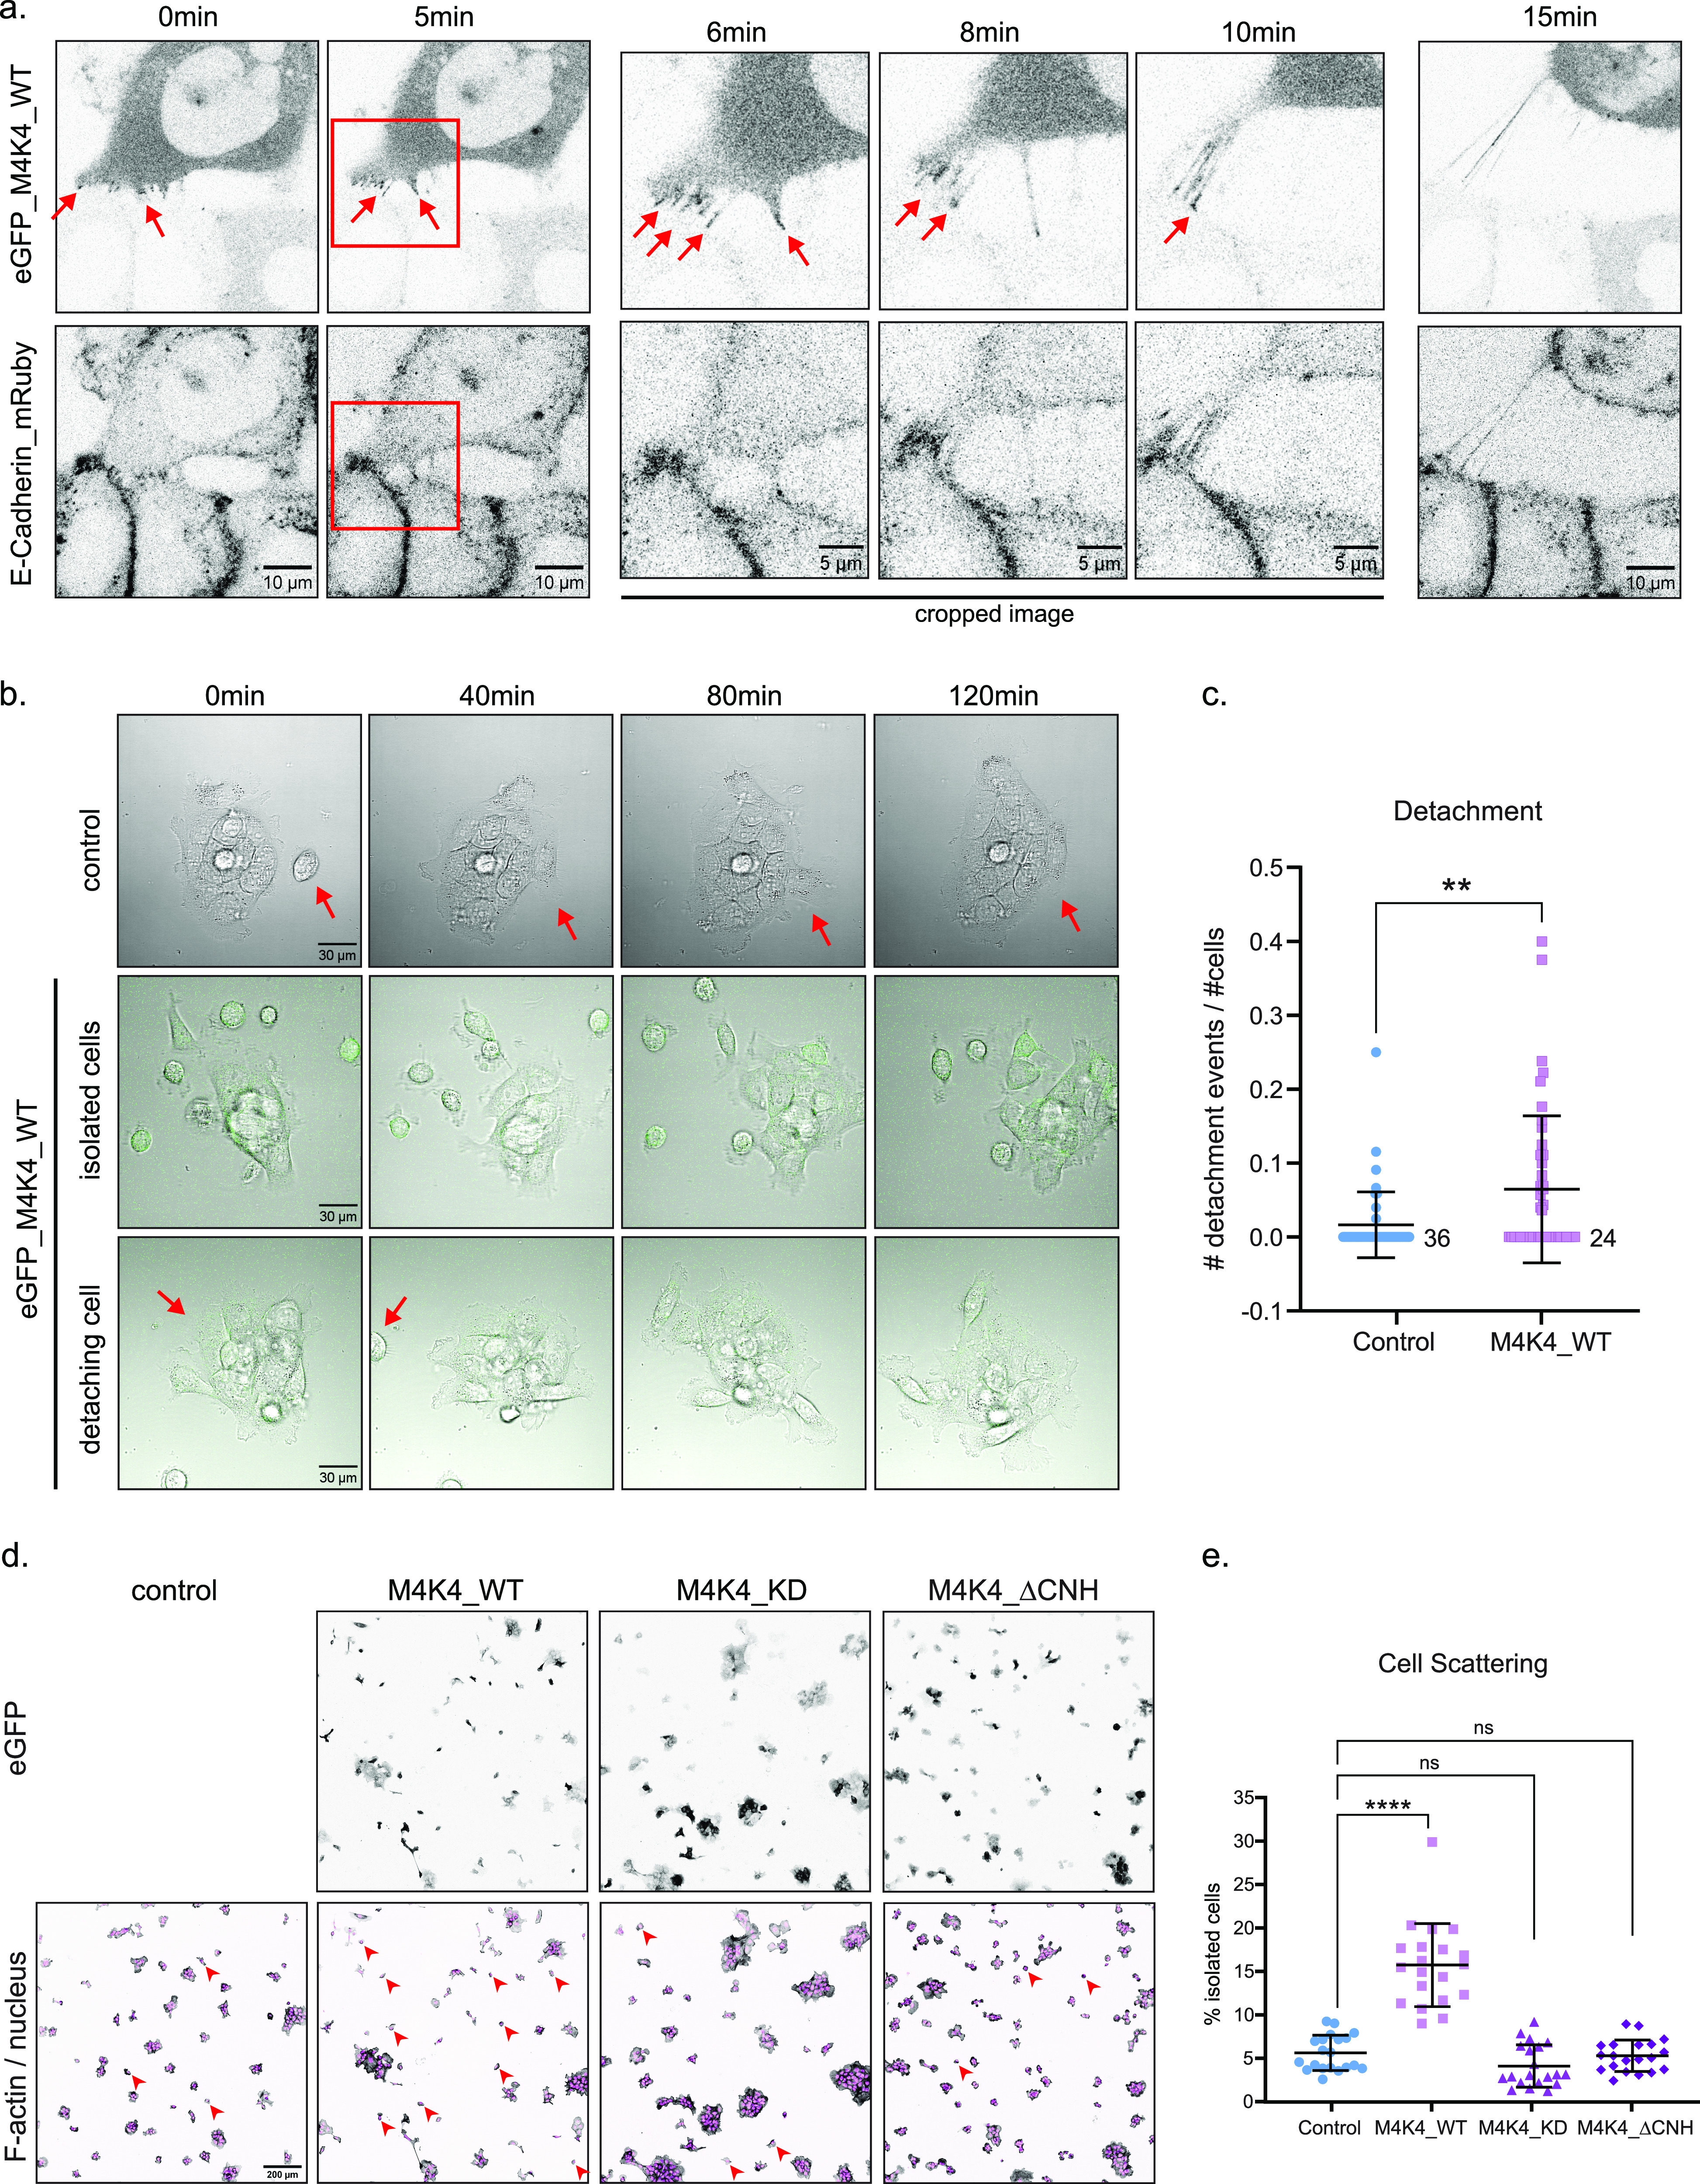
Figure 6. MAP4K4 accumulates in the interface of detaching cells and induces cell scattering.

(A) Confocal images acquired during time-lapse of A431 cells expressing eGFP–MAP4K4 WT and E-cadherin–mRuby. Arrow indicates accumulation of eGFP–MAP4K4 at cell–cell contacts during cell detachment. Red squares indicate region that was cropped for timepoints 12, 16, and 20 min. Images were acquired every 30 s, during 30 min. (B) Confocal images of DIC and eGFP, acquired during time-lapse of A431 control cells, or A431 cells expressing eGFP–MAP4K4 WT. Top panel represent control cells, middle panel represents MAP4K4-expressing cells that are isolated and very motile, bottom panel represents MAP4K4-expressing cells detaching from a cluster. (C) Mean number of cell detachment events per number of cells in the field of view, during 2 h time-lapse acquisition, every 1 min, on control cells or cells expressing eGFP–MAP4K4 WT. (D) Representative confocal images of A431 cells and clusters stably expressing eGFP–MAP4K4 WT, KD, or ΔCNH. Arrowheads indicate examples of isolated cells under each condition. (E) Percentage of cell scattering in A431 control, or overexpressing eGFP–MAP4K4 WT, KD, or ΔCNH. Data on (C, E) are represented as mean ± s.d. and tested by Kruskal–Wallis test (ns, nonsignificant; *P < 0.05, **P < 0.01, ***P < 0.001, ****P < 0.0001).
