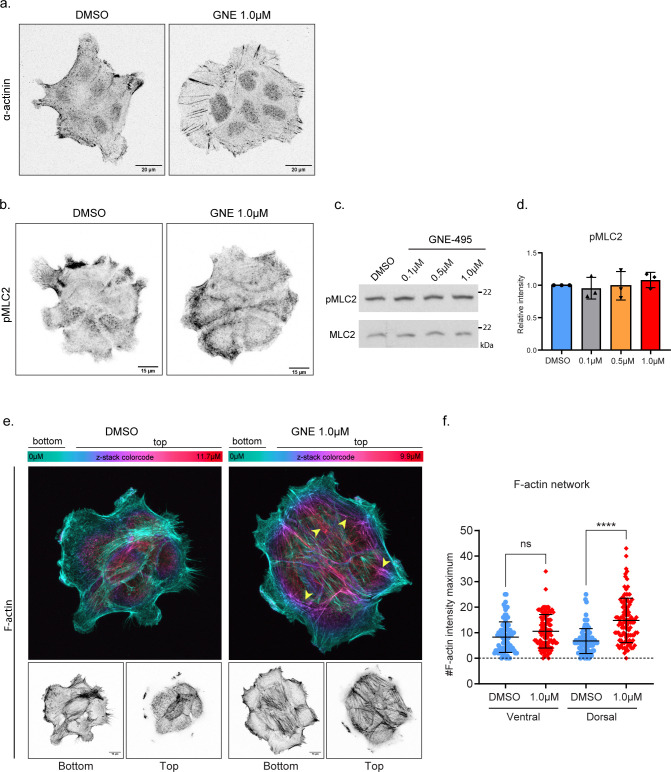
Figure S4. Effect of MAP4K4 loss of function on cluster cytoskeleton.
(A) Confocal z-scan projection of representative A431 clusters treated with DMSO or GNE-495 at 1.0 μM and stained for α-actinin. (B) z-scan projections of representative confocal images of pMLC2 stained A431 treated with DMSO or GNE-495 at 1.0 μM. (C) Representative immunoblotting of pMLC2 and MLC2 using lysates of A431 cells treated with DMSO or indicated doses of GNE-495. (D) Ratio of pMLC2/MLC2 intensities from three independent experiments of A431 clusters treated with the indicated doses of GNE-495, relative to DMSO. (E) Images of representative clusters treated with DMSO or GNE-495 at 1.0 μM stained for F-actin. Upper images are color coded by the position in the z-axis, showing accumulation of thick F-actin at the dorsal part of a cluster treated with GNE-495, indicated by the increase of filaments in purple and magenta (arrowheads). Lower panel shows projection of ventral z-positions (bottom) versus dorsal z-positions (top). (F) Relative abundance of F-actin bundles at ventral or dorsal part of clusters treated with DMSO or GNE-495 at 1.0 μM, calculated as described in the Materials and Methods section. At least 25 clusters from three independent experiments were analyzed. (C, D) Data on (D) are represented as mean ± s.d. and tested by Mann–Whitney test. Data on (F) are presented as mean ± s.d. and tested by Kruskal–Wallis test. (ns, nonsignificant; *P < 0.05, **P < 0.01, ***P < 0.001, ****P < 0.0001).

