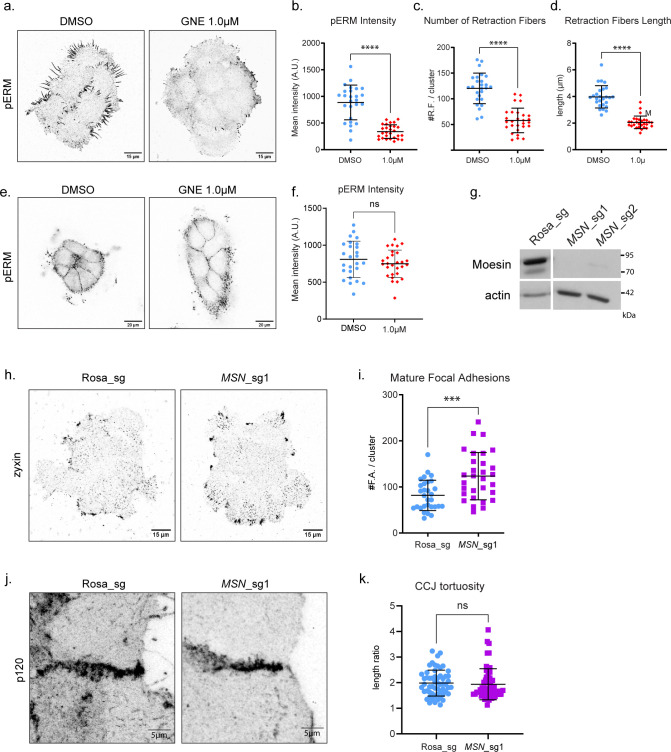
Figure S5. MSN KO phenocopies MAP4K4 KO for focal adhesion, but not at cell–cell junction.
(A) Representative confocal images of pERM staining, at the substrate z focal plane, from clusters treated with DMSO or GNE-495 at 1.0 μM. (B) Quantification of mean intensity of pERM from clusters treated with DMSO or GNE-495 at 1.0 μM. At least 25 clusters from three independent experiments were analyzed. (C, D) Number and (D) length of retraction fibers of clusters treated with DMSO or GNE-495 at 1.0 μM. At least 25 clusters from three independent experiments were analyzed. (E) Representative confocal images of pERM staining at the cell–cell junction z focal plane, from clusters treated with DMSO or GNE-495 at 1.0 μM. (F) Quantification of mean intensity of pERM of clusters treated with DMSO or GNE-495 at 1.0 μM. At least 25 clusters from three independent experiments were analyzed. (G) Representative immunoblotting of moesin and actin from lysates of A431 cells control (Rosa_sg) or KO for MSN using two independent sgRNA sequences (MSN_sg1, MSN_sg2). (H) Representative confocal images of control or MSN KO clusters stained for zyxin. (I) Number of zyxin-positive focal adhesions in control or MSN KO clusters. (J) Representative confocal z-scan projection of p120 stained cells, control or KO for MSN, showing cell–cell junction morphology. (K) Tortuosity index of cell–cell junction on control or MSN KO cells. At least three junctions of five different clusters per experiment, from three independent experiments were analyzed. All the data are presented as mean ± s.d. and tested by Mann–Whitney test (*P < 0.05, **P < 0.01, ***P < 0.001, ****P < 0.0001).

