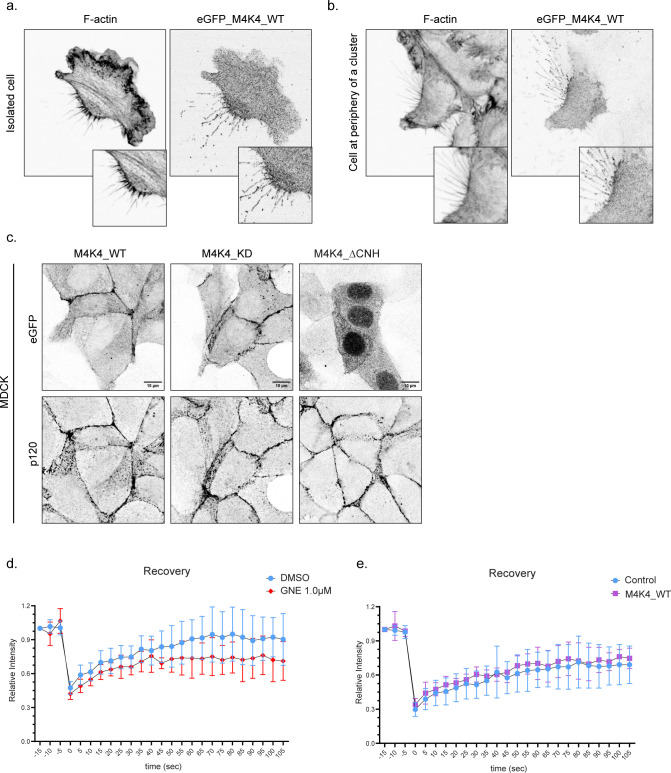
Figure S6. MAP4K4 localizes at retraction fibers and adherens junctions in A431 cells and MDCK cells.
(A, B) Representative confocal images of an isolated cell (A) or cell at cluster periphery (B) retracting, expressing eGFP–MAP4K4_WT, showing MAP4K4 localization at retraction fibers and at the base of the retraction in A431 cells. (C) Representative confocal images of confluent MDCK cells expressing eGFP–MAP4K4_WT, KD, or ΔCNH. Staining of p120-catenin indicates cell–cell junctions. (D) Relative intensity recovery rates of A431 cells expressing E-cadherin–mRuby, treated with DMSO or GNE-495 at 1.0 μM. (E) Relative intensity recovery rates of A431 cells expressing E-cadherin–mRuby, control or expressing eGFP–MAP4K4_WT.

