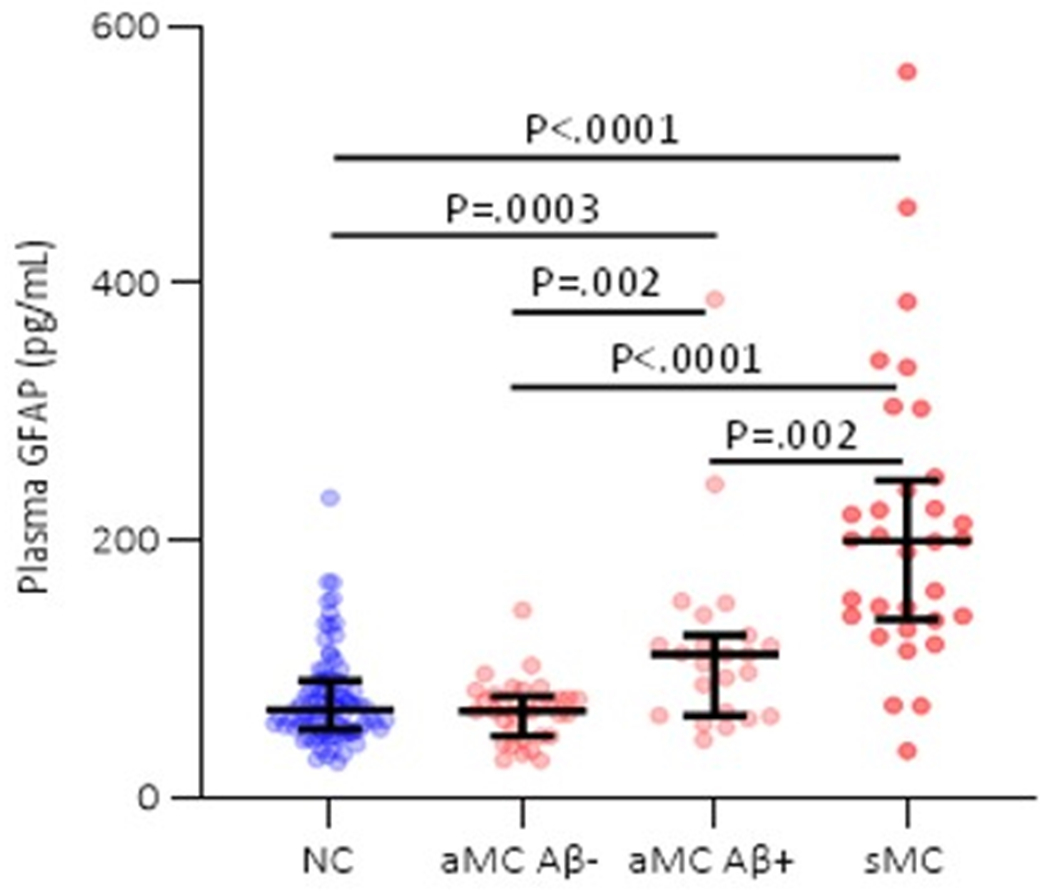
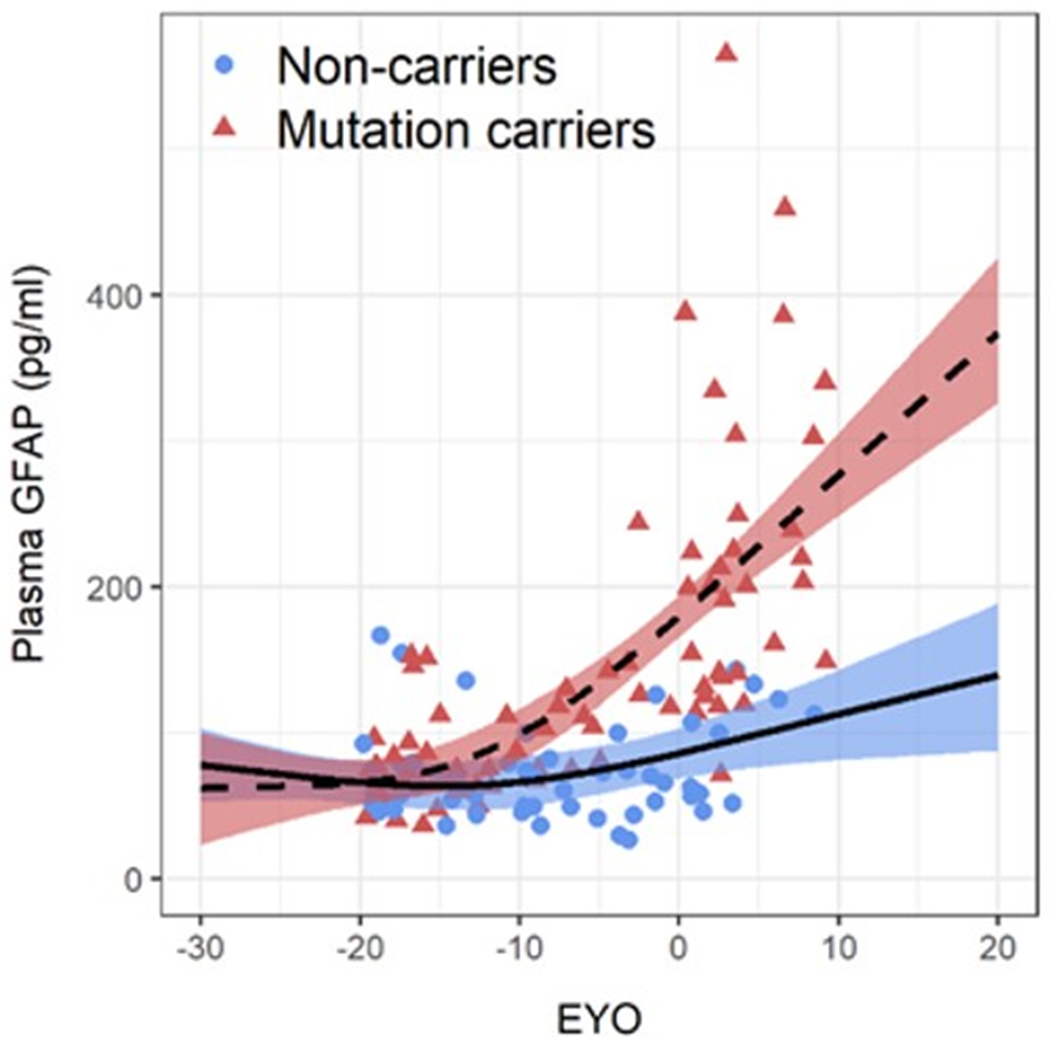
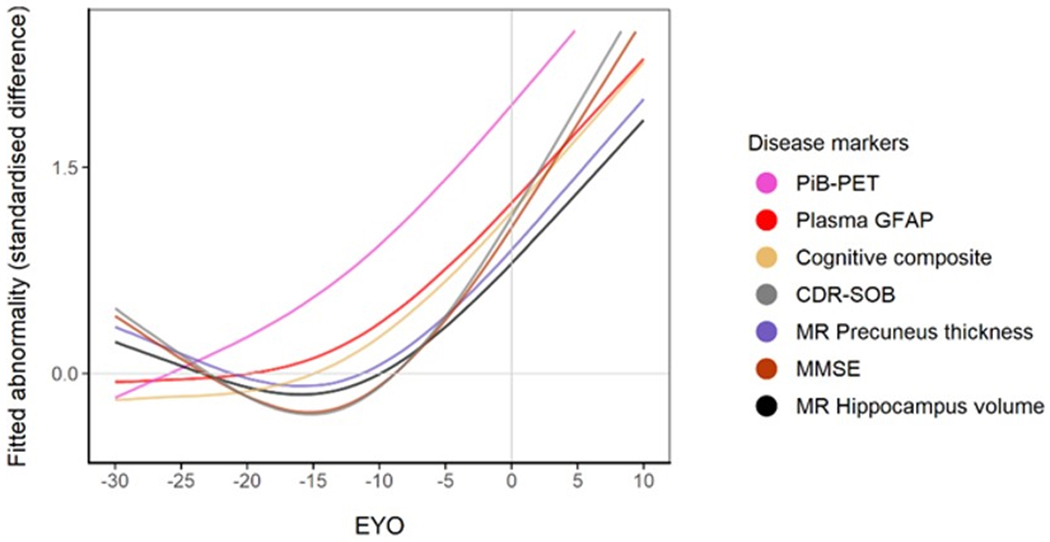
Figure 1. Plasma GFAP in ADAD mutation non-carriers and carriers.


(a) Comparison of plasma GFAP levels between non-carriers (NC, n=86), Aβ-PET negative asymptomatic mutation carriers (aMC Aβ−, n=33), Aβ-PET positive asymptomatic mutation carriers (aMC Aβ+, n=23) and symptomatic mutation carriers (sMC, n=32). The middle line represents the median and the error bars represent the interquartile range. Natural log GFAP values were used to calculate P values from LMEMs adjusting for age and sex with family as a random effect with Tukey’s post hoc test for pairwise comparisons. P<.05 was considered statistically significant and all tests were two-tailed. (b) Plasma GFAP levels as a function of expected years to symptom onset (EYO) for mutation carriers and non-carriers. The curves and shaded 95% credible intervals represent the distributions of model fits derived by the Hamiltonian Markov chain Monte Carlo analyses (refer to Methods section). The displayed points on the EYO are jittered and the range limited to −20 to +10 to prevent inadvertent identification of individuals contributing to the study dataset. (c) Divergence curves show the standardised differences between mutation carriers and non-carriers by EYO, which was considered significant when the 99% credible interval did not include 0. The y-axis represents the degree of abnormality of the markers in a comparable way. The temporal EYO order of this divergence was after aberrant amyloid-β (Aβ) accumulation started and before cognitive decline and neurodegeneration: PiB-PET −18.4; Plasma GFAP −10.0; Cognitive Composite −7.9; CDR-SOB −5.3; MR Precuneus Thickness −5; MMSE −4.7; MR Hippocampal volume −4.2.
