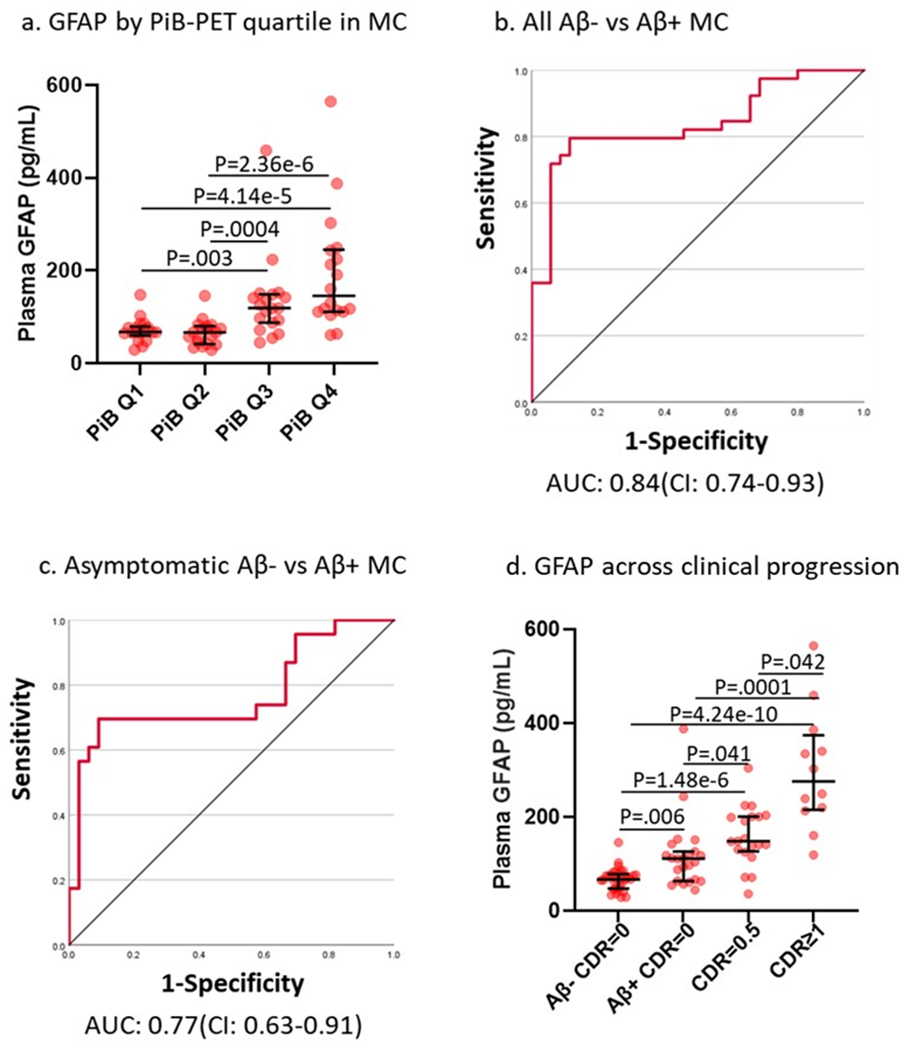
Figure 3. Plasma GFAP levels and Aβ-PET load, Aβ-PET −/+ status and clinical progression in ADAD.

(a) Plasma GFAP by PiB-PET quartile (n(Q1: Aβ SUVR≤1.07)=18; n(Q2: 1.07<Aβ SUVR≤1.26)=19; n(Q3: 1.26<Aβ SUVR≤2.10)=19; n(Q4: Aβ SUVR>2.10)=18) in mutation carriers suggests higher plasma GFAP levels with increasing PiB-PET uptake (Kruskal-Wallis test followed by pairwise comparisons). Receiver operating characteristic curves using plasma GFAP to distinguish between Aβ-PET negative/positive based on PiB-PET SUVR in (b) all mutation carriers (Aβ− SUVR<1.25 (n=35); Aβ+ SUVR≥1.25 (n=39)) and (c) in asymptomatic mutation carriers (Aβ− SUVR<1.25 (n=33); Aβ+ SUVR≥1.25 (n=23)). (d) Higher plasma GFAP levels in mutation carriers (n(Aβ− CDR=0)=33, n(Aβ+ CDR=0)=23, n(CDR=0.5)=20, n(CDR≥1)=12) with clinical progression. GFAP increases with the onset of amyloid-β pathology and continues to increase with clinical severity in mutation carriers (Kruskal-Wallis test followed by pairwise comparisons). For plots in a and d, the middle line represents the median and the error bars represent the interquartile range. P<.05 was considered statistically significant and all tests were two-tailed.
