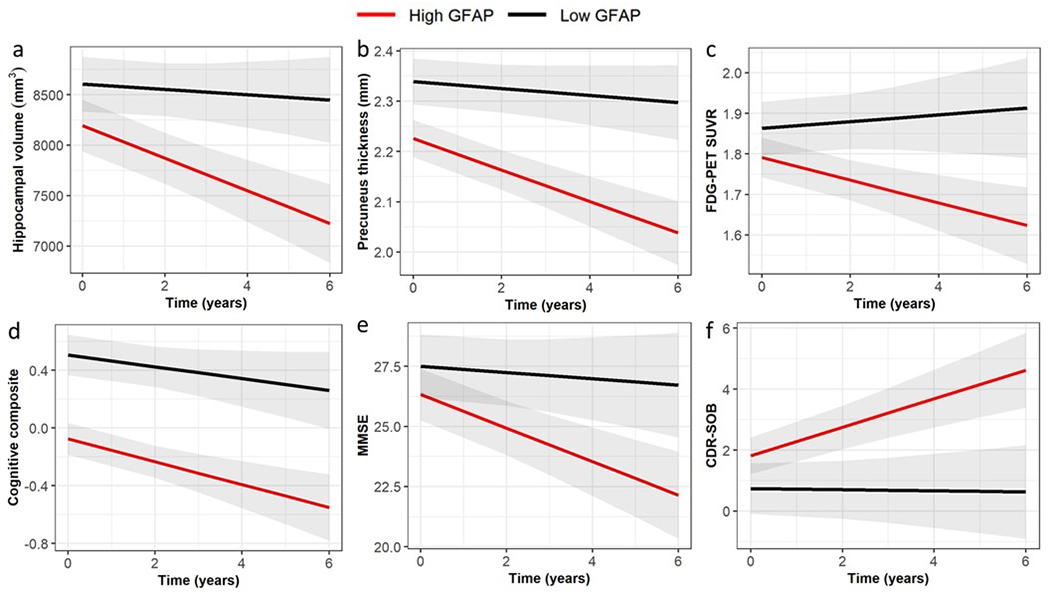
Figure 4. Association of plasma GFAP with prospective neurodegeneration, cerebral glucose hypometabolism and cognitive and functional decline in mutation carriers.

Relationships between plasma GFAP and change in neurodegeneration (represented by hippocampal volume (B=−0.202, P=.013) and precuneus thickness (B=−0.039, P=.001), cerebral glucose metabolism (FDG-PET, B=−0.031, P=.150) and cognition (represented by Mini-Mental State Examination (MMSE, B=−0.722, P=.041) and Clinical Dementia Rating – Sum of Boxes (CDR-SOB, B=0.570, P=.013) were assessed using LMEMs, with covariates age and sex (and education for cognition) with family as a random effect. Unstandardised B and P-values were calculated using natural log GFAP. For this visualization, the cut-off for low/high GFAP was based on the optimal cut-point at Youden’s index (low (<87.5 pg/mL, black) and high (≥87.5 pg/mL, red)). P<.05 was considered as statistically significant.
