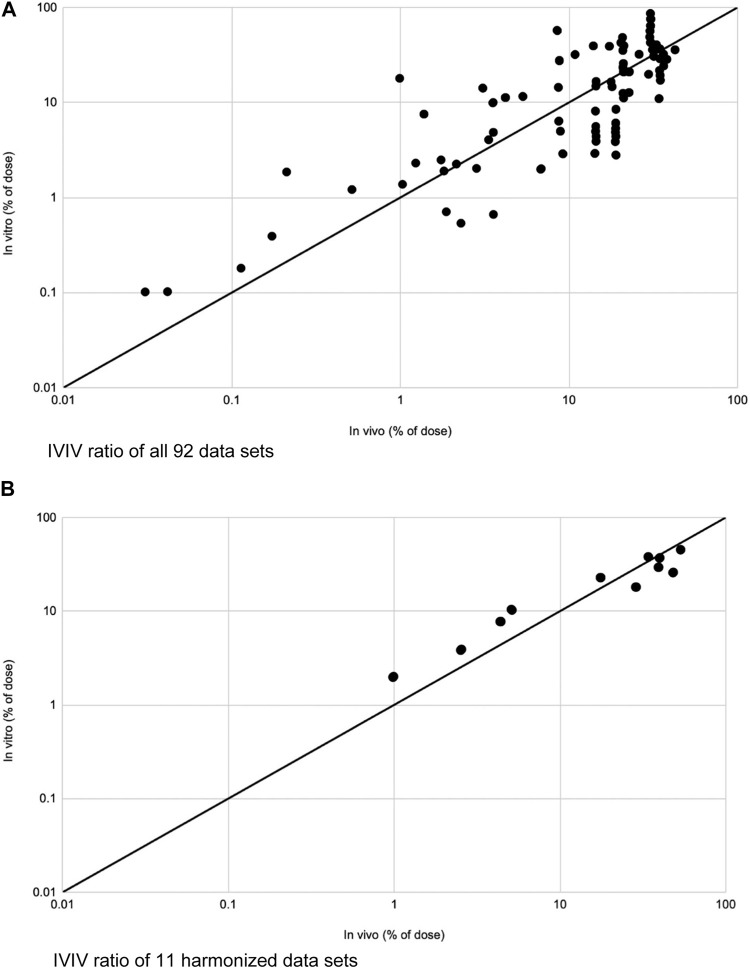
FIGURE 3.
Modified from Lehman et al. (Lehman et al., 2011). (A) IVIV ratios of total absorption of 92 data sets plotted on a logarithmic scale. IVIV ratios ranged from 0.18 to 19.7. Mean was 1.6. Solid line depicts an ideal 1:1 IVIV correlation. (B) IVIV ratios of total absorption for 11 fully harmonized data sets on logarithmic scale. IVIV ratios ranged from 0.58 to 1.28. Mean was 0.96. Solid line depicts an ideal 1:1 IVIV correlation.

