Figure 1.
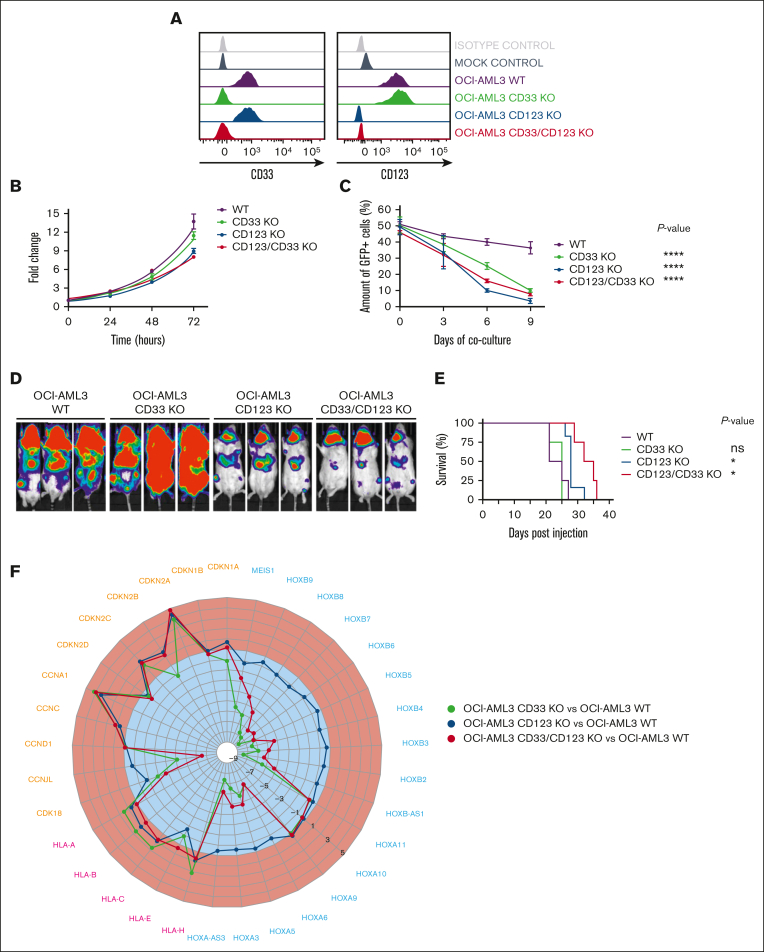
CD33 and/or CD123 KO affects proliferation in NPM1 mutant OCI-AML3 cell line. (A) Representative histograms of CD33 and CD123 expression in WT and KO OCI-AML3 Luc/GFP+ clones, measured by flow cytometry after single-cell cloning. (B) Cell growth expansion curves of CD33 and/or CD123 KO Luc/GFP+ clones compared with the parental WT Luc/GFP+ OCI-AML3 cell line, monitoring luminescence emitted 2 hours after luciferine exposure for 3 days using a Spark plate reader (Tecan). Mean ± SD from biological triplicates is shown. (C) Luc/GFP+ OCI-AML3 KO cells were cocultured with GFP- OCI-AML3 WT cells at a 1:1 E:T ratio, and GFP expression was measured to assess clonal competition at the indicated time points by flow cytometry. Mean ± SD from representative biological triplicates is shown. P values from the Wilcoxon test are indicative of each KO clone condition compared with WT OCI-AML3 control at day 9. ∗∗∗∗P value <.0001. (D) Tumor burden of Luc/GFP+ OCI-AML3 WT and KO clones, measured by bioluminescent imaging at day 21 after NSG mice injection. (E) Kaplan-Meier curves of overall survival after Luc/GFP+ OCI-AML3 cell injection. P values adjusted for multiple comparisons are from the log-rank test and indicate comparisons between each KO clone condition and WT OCI-AML3 control. ∗P value <.05; ns, not significant (P value >.05). P values are indicative of each KO clone condition compared with WT OCI-AML3 control. (F) Gene expression variation of cyclin, HLA, and HOX family–related DEGs in OCI-AML3-CD33 KO, CD123 KO, and CD33-123 KO compared with WT. Upregulated and downregulated DEGs (log2 fold change) are colored in red and blue, respectively. DEGs, differentially expressed genes; GFP, green fluorescent protein; SD, standard deviation.

