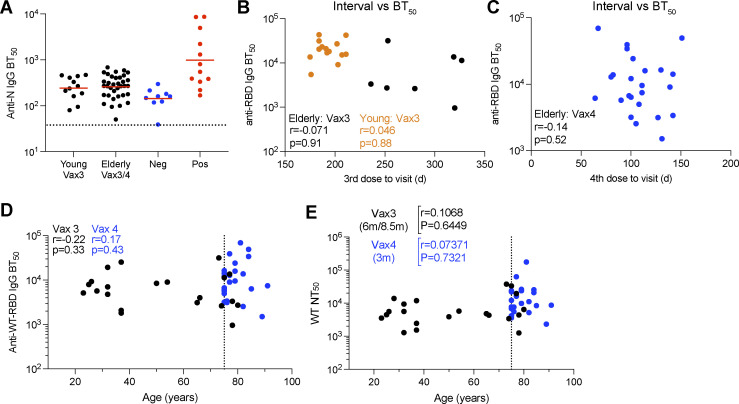
Figure S1.
Plasma ELISA. (A) BT50s for anti-nucleocapsid (N) IgG. (B and C) BT50s for anti-RBD IgG plotted against intervals between vaccine doses and blood collection. (D and E) Age (x axis) plotted against BT50s for anti-RBD IgG (y axis; D) or NT50s for WT (y axis; E). All experiments were performed at least in duplicate and repeated twice. The elderly Vax4 value is shown in blue. Statistical significance was determined by two-tailed Spearman’s correlation.

