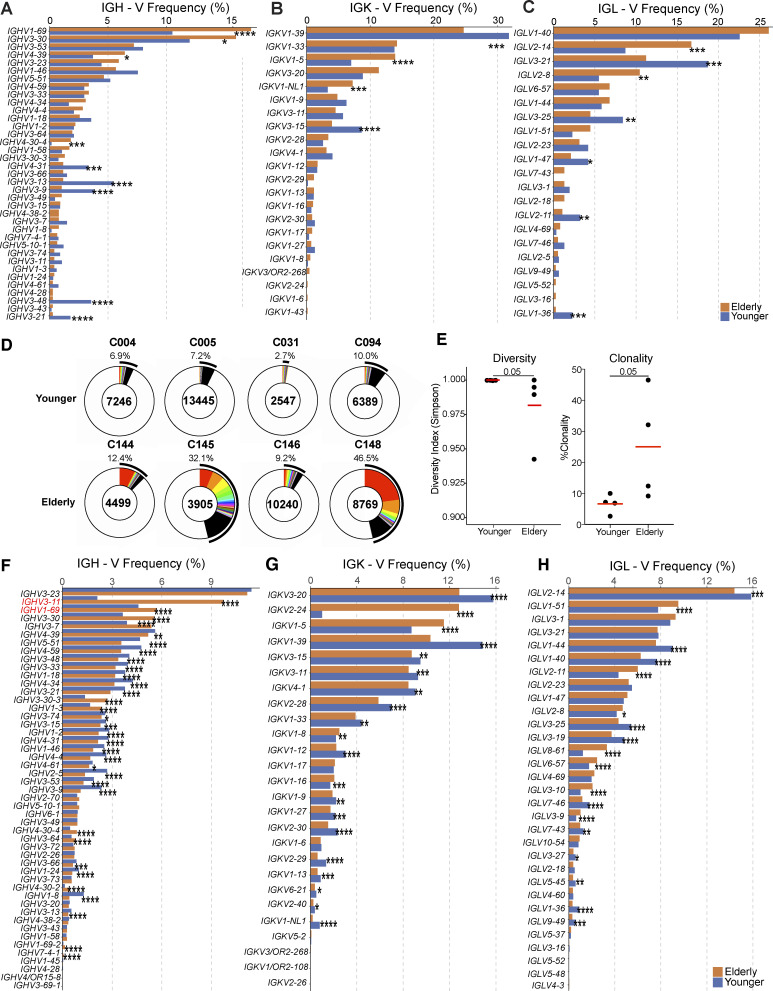
Figure S3.
Analysis of BCR repertoire. (A–C) Comparison of the frequency distribution of human V genes for heavy chain and light chains of anti-RBD antibodies. The graph shows the relative abundance of human IGHV (A), IGKV (B), and IGLV (C) genes in antibodies obtained from elderly (orange), and younger vaccinees (blue). Statistical significance was determined by two-sided binomial test. *, P ≤ 0.05; **, P ≤ 0.01; ***, P ≤ 0.001; ****, P ≤ 0.0001. (D–H) Distribution of BCR repertoire and frequency distribution of V genes in circulating B cells. (D) Pie charts show the relative size of BCR clones as slices. The areas indicated in white represent unique BCR sequences. The number above the pie chart is the donor ID for each individual. The number in the center of the pie chart represents the number of cells assayed for each individual. (E) The Shannon–Weiner index for diversity analysis (left panel) and clonality analysis (right panel) of the sequences from D. (F–H) Graph shows the relative abundance of human IGHV (F), IGKV (G), and IGLV (H) genes in antibodies genes obtained from elderly (orange), and younger vaccinees (blue). Statistical significance was determined by Mann-Whitney test for E and two-sided binomial test for A–C and F–H. *, P ≤ 0.05; **, P ≤ 0.01; ***, P ≤ 0.001; ****, P ≤ 0.0001.

