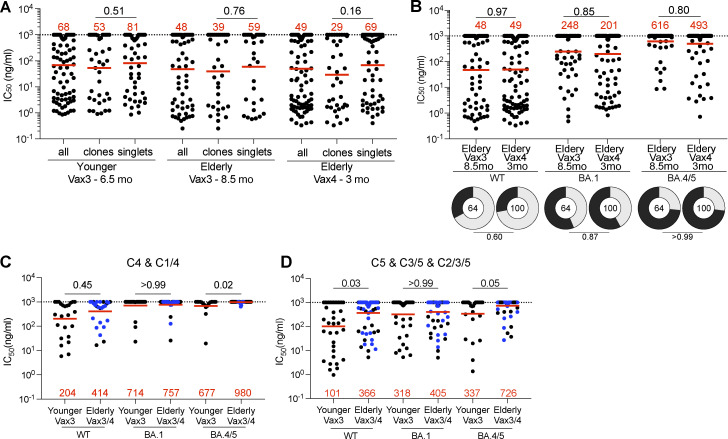
Figure S5.
mAb neutralizing breadth. (A) Graphs show anti-SARS-CoV-2 neutralizing activity (IC50s) of mAbs (n = 253) measured by a SARS-CoV-2 pseudotype virus neutralization assay using WT spike, for all tested antibodies, clones, and singlets. (B) Graphs show anti-SARS-CoV-2 neutralizing activity (IC50s) of mAbs isolated from the elderly vaccinees after Vax3 or Vax4, against WT, Omicron BA.1, and Omicron BA.4/5 SARS-CoV-2 pseudoviruses. Pie charts illustrate the fraction of neutralizing (IC50 < 1,000 ng/ml) antibodies (gray slices) and non-neutralizing (IC50 > 1,000 ng/ml) antibodies (dark slices), inner circle shows the number of antibodies tested per group. (C and D) Graphs showing IC50 neutralization activity of Class 4, 1/4 (C), and Class 5, 3/5, and 2/3/5 antibodies among all antibodies in Fig. 4 A. The deletions/substitutions corresponding to viral variants were incorporated into a spike protein that also includes the R683G substitution, which disrupts the furin cleavage site and increases particle infectivity. Neutralizing activity against mutant pseudoviruses was compared to a WT SARS-CoV-2 spike sequence (NC_045512), carrying R683G. All experiments were performed at least in duplicate and repeated twice. Each dot represents one antibody. Antibodies sequences from elderly Vax4 are shown in blue. Red bars and values represent geometric mean values. Horizontal bars and red numbers indicate geometric mean values. Statistical significance was determined by Mann–Whitney test and for the ring plots in B by two-sided Fisher’s exact test.

