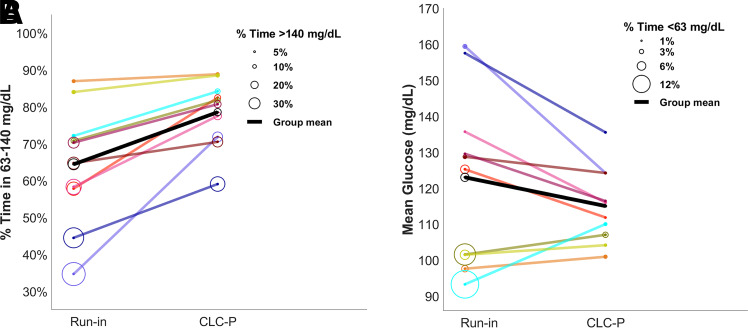
Figure 2.
Individual participant times spent in target range and above target range, mean glucose, and time spent below target range. A: Percent time spent in the target range 63–140 mg/dL (line) and above the target range (circle size). B: Mean continuous glucose monitoring–measured glucose (line) and percent time spent below the target range (circle size). Each participant’s data are depicted with a separate color, and individual results are provided in Supplementary Material. The same color is used for the same participants throughout the panels. To convert values for glucose to millimoles per liter, multiply by 0.05551.

