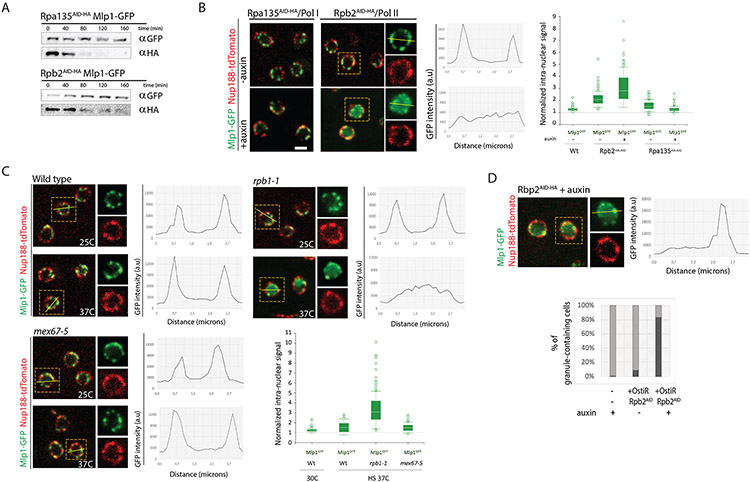
Figure 2. Inhibition of RNA polymerase II transcription, but not mRNA export, affects basket assembly.
A. Western blot of total cell lysates from Rpb2AID-HA and Rpa135AID-HA cells upon auxin addition. B. Mlp1-GFP localization pre- and post-addition of auxin (500 μM, 120mins) in Rpb2AID-HA and Rpa135AID-HA cells. Nup188-tdTomato outlines nuclear periphery. For Rpb2AID-HA cells, line scan intensity plot shows Mlp1-GFP signal distribution in a single cell pre/post-auxin. Bar graph shows quantification of Mlp1-GFP intranuclear signal (n=100). C. Mlp1-GFP distribution in wt, rpb1-1 and mex67-5 cells at 25°C and 37°C. Line scan intensity plots show Mlp1-GFP signal distribution, bar graphs quantification of average Mlp1-GFP intranuclear signal intensities in the center of nuclei over background. D. Mlp1-GFP granule formation in Rpb2AID-HA cells 120 min post-auxin. Histogram quantification of % cells with Mlp1-GFP granules post-Rbp2 depletion. Scale bar = 2μm. Data are represented as mean ± SEM.

