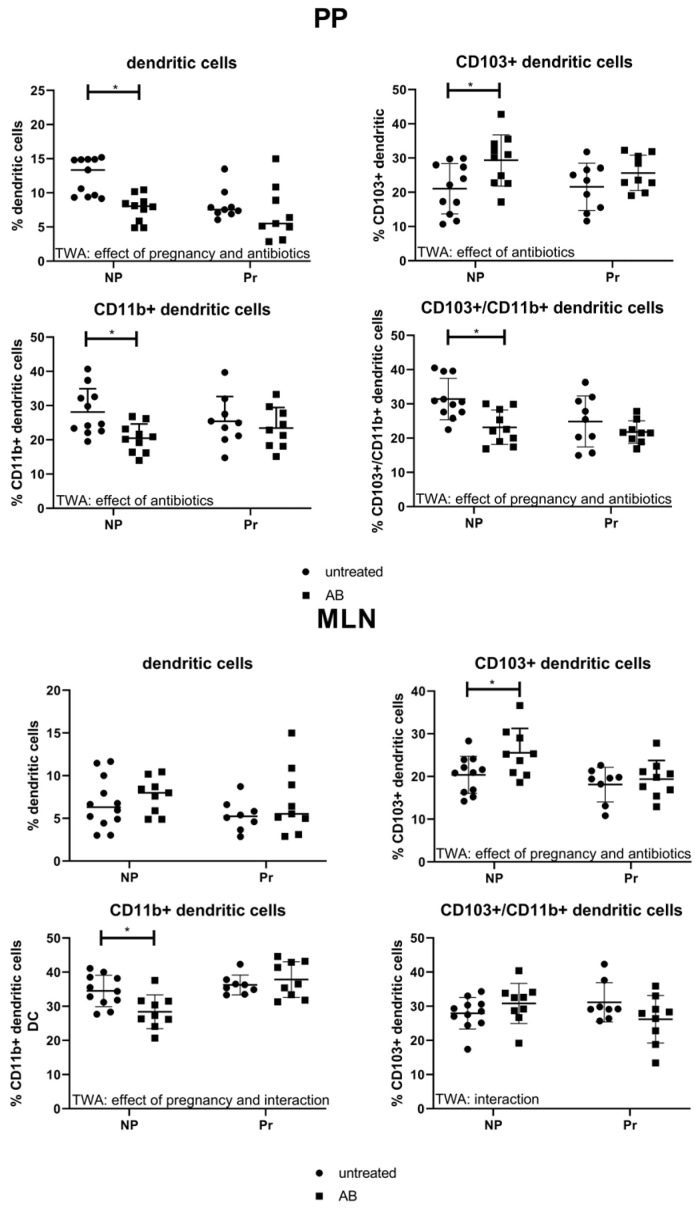
Figure 4.
Percentage of dendritic cells and dendritic cell populations in the PP (left) and MLN (right) of pregnant and non-pregnant control and AB-treated mice. Pregnant AB-treated mice: n = 9; untreated pregnant mice: n = 9 (n = 8 for MLN, from 1 mouse, the MLN was not isolated); non-pregnant AB-treated mice: n = 10 (n = 9 for MLN, from 1 mouse the MLN was not isolated); untreated non-pregnant mice: n = 11. *: Two-way ANOVA was performed for all subsets in the PP and MLN, followed by Sidak’s multiple comparison test, p < 0.05.

