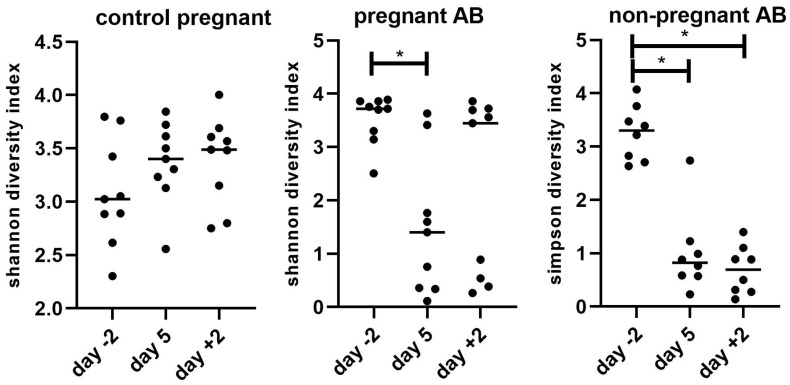
Figure 7.
Shannon diversity index of control pregnant mice and of pregnant and non-pregnant AB-treated mice, before, during and after AB treatment. Pregnant AB-treated mice: n = 9; untreated pregnant mice: n = 9; non-pregnant AB-treated mice: n = 8. *: Friedman followed by Dunn’s multiple comparison test, p < 0.05.

