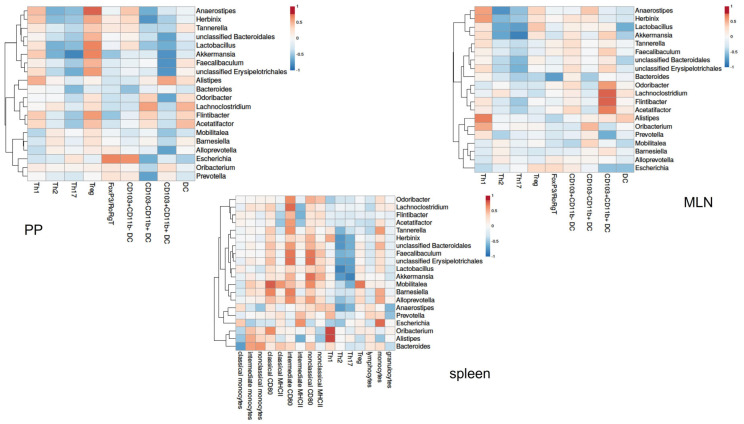
Figure 11.
Correlation between immune cell populations in the PP (top left heatmap) and MLN (top right heatmap) and peripheral cells (lower heatmap) in pregnant mice. The heatmaps show Spearman’s correlations coefficients after individual correlation of PPs, MLN or peripheral immune cells (on the x-axis) with bacterial genera that were significantly different between day −2 and day +2. Pregnant AB-treated mice: n = 9; untreated pregnant mice: n = 9.

