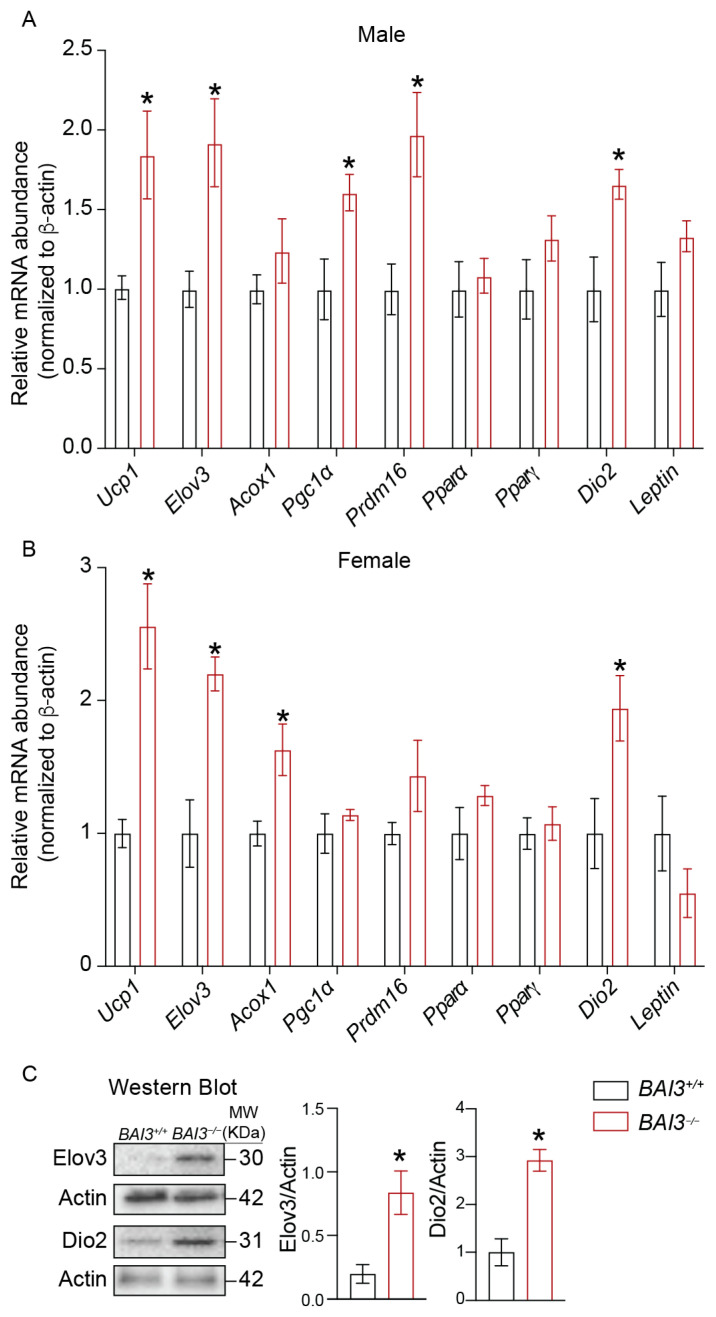
Figure 7.
The mRNA and protein abundance in BAT. Total mRNA was prepared from BAT. The steady-state mRNA abundance of genes was expressed relative to the β-actin was determined using qPCR in males (A) and females (B). Western blots assessing the relative protein abundance normalized to actin (C). Data are reported as the mean ± SEMs, n = 4, * p < 0.05.

