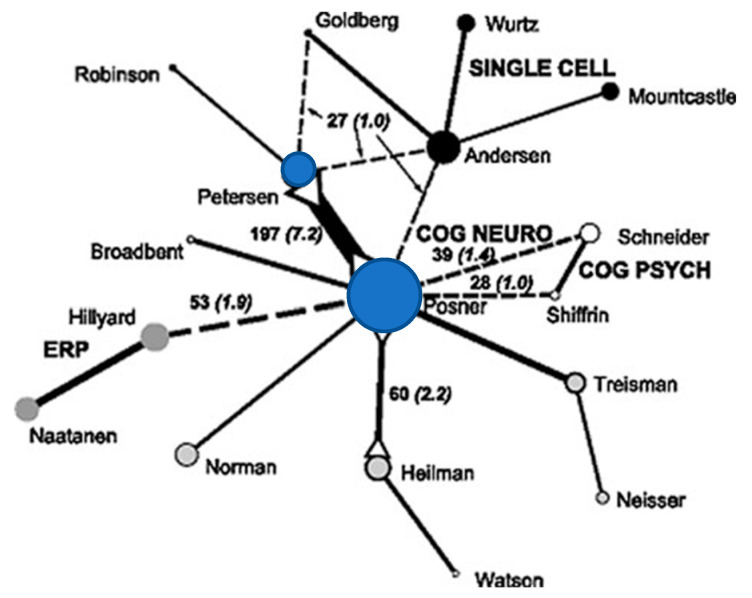
Figure 2.
Connections among citations for the year 1995 between neurophysiology (black circles); cognition (open circles); ERP and Neurology (grey circles) showing Posner and Petersen (blue circles) as central connections. The numbers of co-citations are in black and those in ( ) are the % of all co-citations. Solid lines represent strong connections, dotted line weaker ones. The circle size represents the number of citations included in the analysis. Adapted with permission, Bruer (2010).

