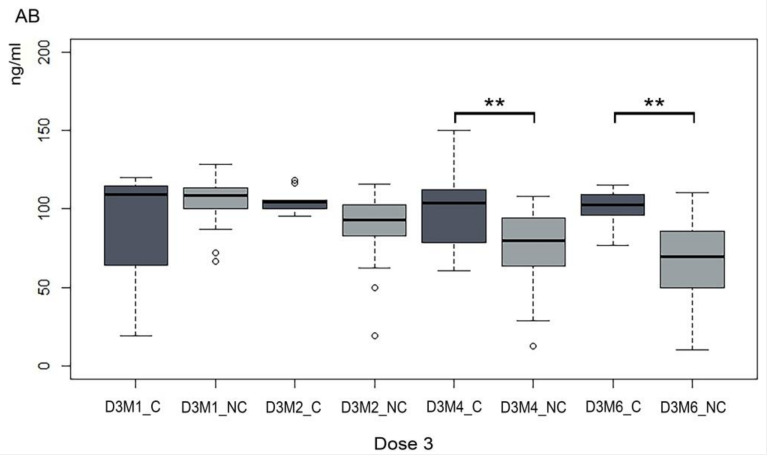
Figure 2.
A comparative trend of the Ab titer in infected and not infected HCW. For each time point, antibody levels (ng/mL) were compared between those who had (C) and had not (NC) contracted SARS-CoV-2 up to that time point. D3M1_NC = no SARS-CoV-2 infection 1 months after booster; D3M1_C = SARS-CoV-2 infection 1 months after booster; D3M2_NC = no SARS-CoV-2 infection 2 months after booster; D3M2_C = SARS-CoV-2 infection 2 months after booster; D3M4_NC = no SARS-CoV-2 infection 4 months after booster; D3M4_C = SARS-CoV-2 infection 4 months after booster; D3M6_NC = no SARS-CoV-2 infection 6 months after booster; D3M6_C = SARS-CoV-2 infection 6 months after booster. Asterisks indicate significant differences ** = p < 0.05.

