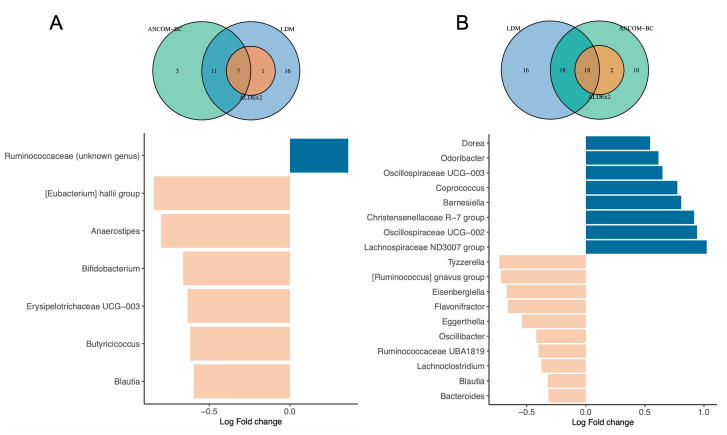
Figure 3.
Differential abundance genus associated with gestational age and household siblings. Ven diagrams at the top of each barplot illustrate the number of differentially abundant genera identified by each method as well as overlaps of the three different methods. Barplots show the ANCOM—BC log-transformed in abundance results at the genus level. Barplots are colored based on positive or negative Log Fold change in abundance. Results from the other methods at both genus and family levels are presented as Supplementary Material (Table S2). (A) Differential abundance testing for gestational age (<37 GW vs. ≥37 GW). (B) Differential abundance testing for household siblings (At least one vs. none).

