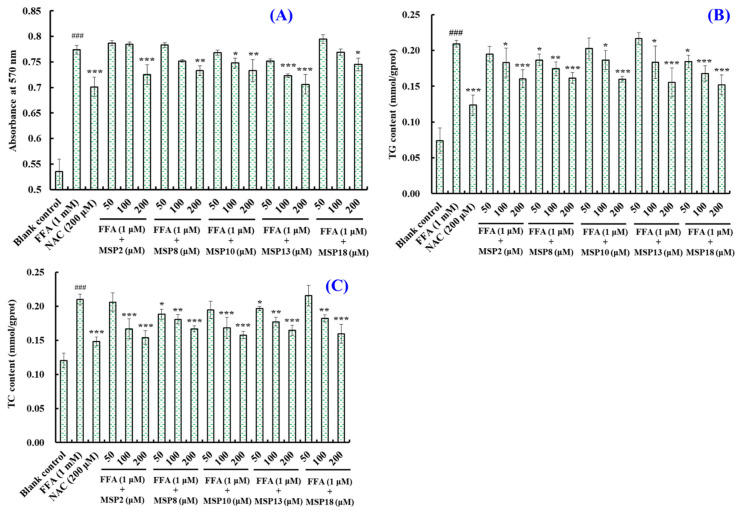
Figure 6.
Effects of MSP2, MSP8, MSP10, MSP13 and MSP18 at 50, 100 and 200 µM on intracellular lipid accumulation (A), and the TG (B) and TC (C) contents in FFA-induced NAFLD model of HepG2 cells for 24 h. NAC at 200 µM was served as the positive control. All data are presented as the mean ± SD of triplicate results. ### p < 0.001 vs. blank control group; *** p < 0.001, ** p < 0.01 and * p < 0.05 vs. FFA-induced NAFLD model of HepG2 cells.

