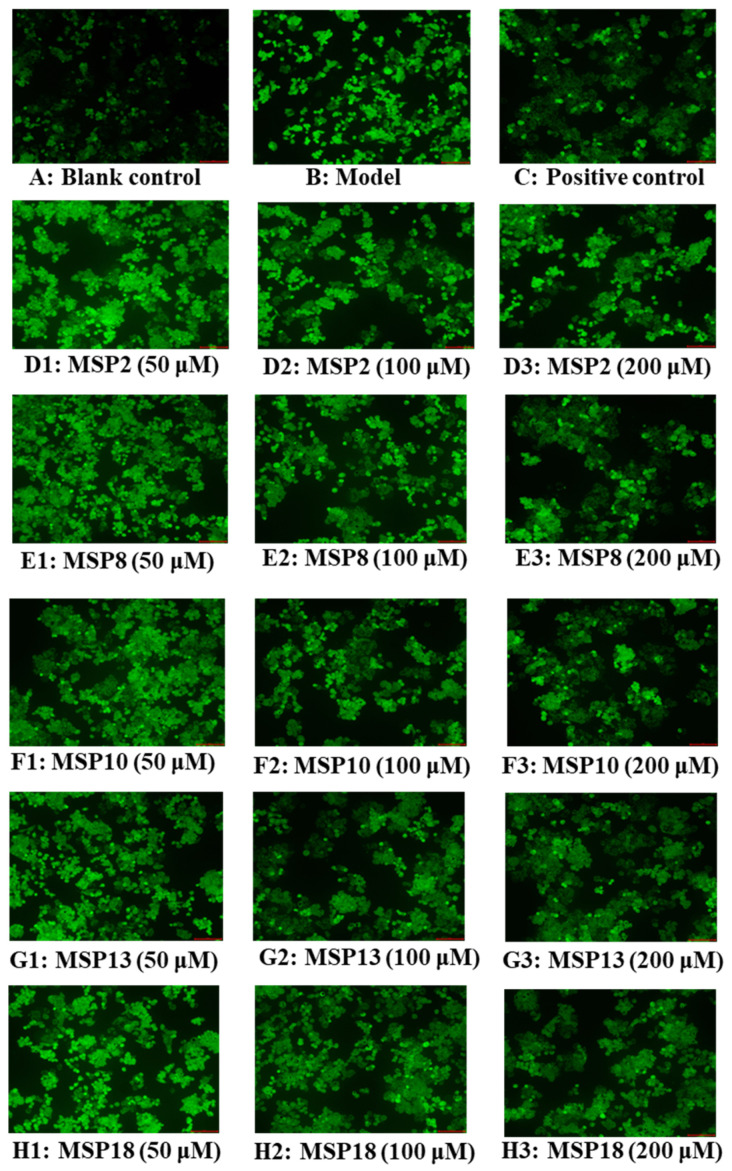
Figure 7.
Determination of ROS levels in HepG2 cells by DCFH-DA staining (20×): (A) blank control; (B) FFA-induced cell model; (C) positive control (NAC); (D1–D3) MSP2 with the concentrations of 50, 100 and 200 μM, respectively; (E1–E3) MSP8 with the concentrations of 50, 100 and 200 μM, respectively; (F1–F3) MSP10 with the concentrations of 50, 100 and 200 μM, respectively; (G1–G3) MSP13 with the concentrations of 50, 100 and 200 μM, respectively; (H1–H3) MSP18 with the concentrations of 50, 100 and 200 μM, respectively.

