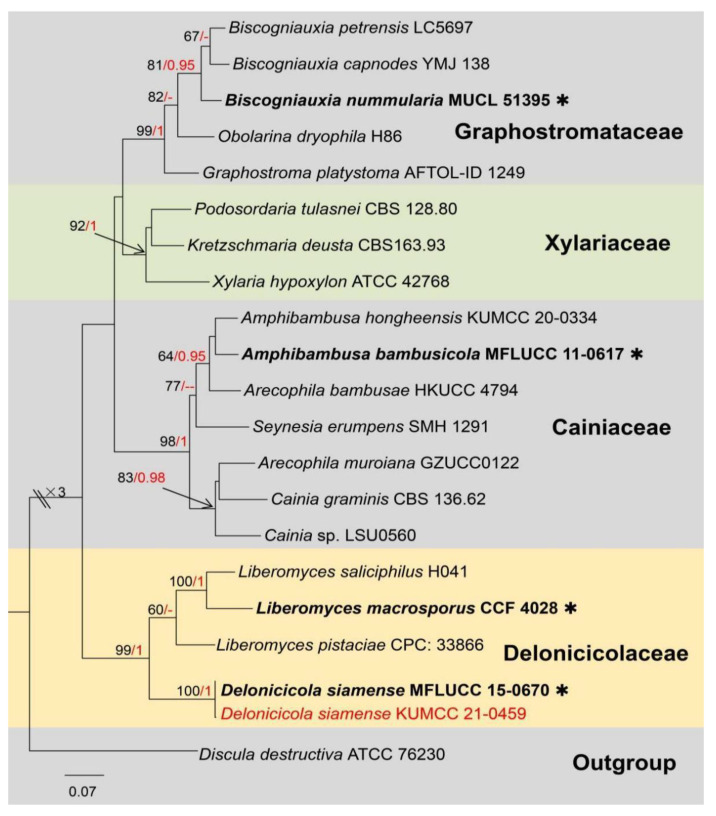
Figure 9.
The phylogram based on a Maximum Likelihood analysis of combined LSU, ITS and rpb2 sequence datasets. Related sequences were taken from Perera et al. [61]. The analyzed gene contains 21 fungal strains and 2500 total characters including gaps (LSU: 1–857 bp, ITS: 858–1463 bp, rpb2: 1464–2500 bp). The tree topology of the ML resembles BI. The matrix had distinct alignment patterns, with the final ML optimization likelihood value of −12,817.082414 (ln). All free model parameters were estimated by the RAxML model, with 987 distinct alignment patterns and 40.49% of undetermined characters or gaps. Estimated base frequencies were as follows: A = 0.258092, C = 0.230665, G = 0.269431 and T = 0.241812, with substitution rates AC = 1.743230, AG = 3.960524, AT = 1.741408, CG = 1.170575, CT = 7.682505 and GT = 1.000000. The gamma distribution shape parameter alpha = 0.453818, and the Tree-Length = 2.619478. The final average standard deviation of split frequencies at the end of total MCMC generations was calculated as 0.009681 in BI analysis. The type strains are denoted in bold with the symbol “✱” at the ends, and newly introduced species in this study are denoted in red. The nodes provide bootstrap values of at least 60% (ML, left) and Bayesian posterior probabilities of at least 0.95 (BI, right); hyphens (-) signify values that are less than 60% in ML and less than 0.95 in BI. The bluish and pale brown backgrounds were used to distinguish different family groups, while the yellow background indicates the Delonicicolaceae and new isolate.

