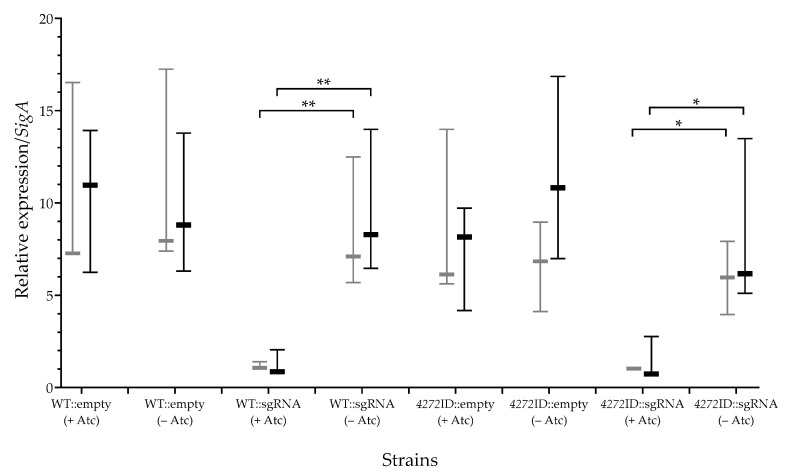
Figure 4.
Expression of MSMEG_4272 relative to sigA expression. RT-qPCR used to determine the total number of MSMEG_4272 transcript copies, at 6 (grey) and 18 h (black) after the addition of Atc, divided by the total number of SigA transcript copies. Plot displays the relative expression of three independent experiments (n = 3) performed as biological replicates. Where appropriate, statistical significance is indicated by p < 0.05 (*) and p < 0.01 (**). GraphPad Prism 8 software was used to determine the p values using an unpaired t test.

