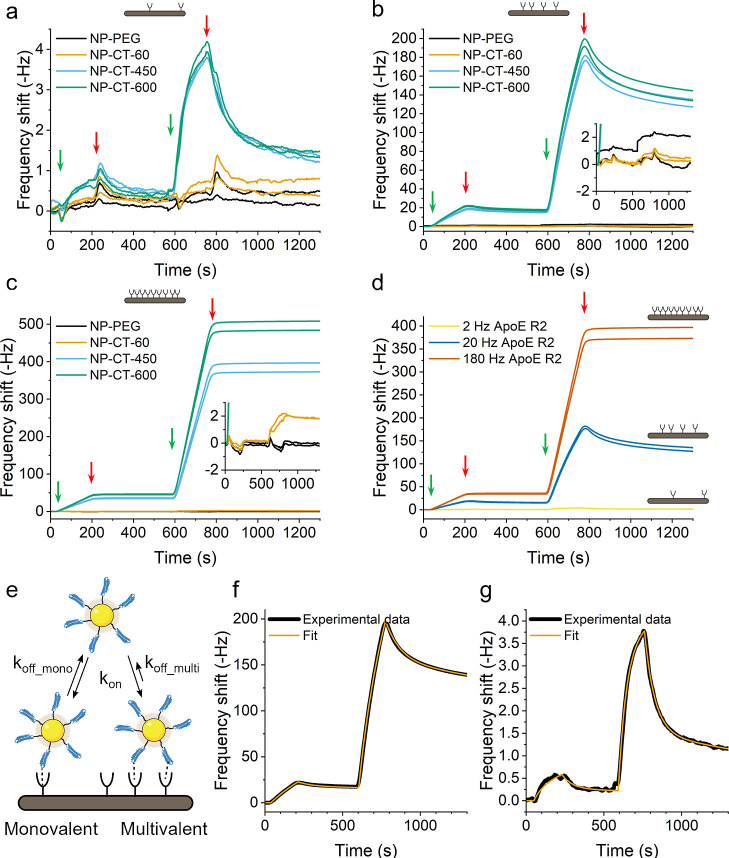
Figure 3.
(a–c) Study of the interaction profile between NP-CT with different grafting densities (number of proteins per NP indicated in the name) and different receptor densities (respectively 2, 20, and 180 Hz). (d) Superimposition of the graph obtained with NP-CT-450 for the 3 different receptor densities. Green arrows indicate injection of 20 mg/L (left) and 200 mg/L of NPs (right). Red arrows indicate the end of the injection. Repeats of the experiment after surface regeneration are presented to demonstrate reproducibility. (e) Multivalent model of binding of NP-CT constructs to ApoER2 surfaces. (f, g) Fits with the model in (e) of NP-CT-600 on medium and low receptor densities of ApoER2, respectively.

