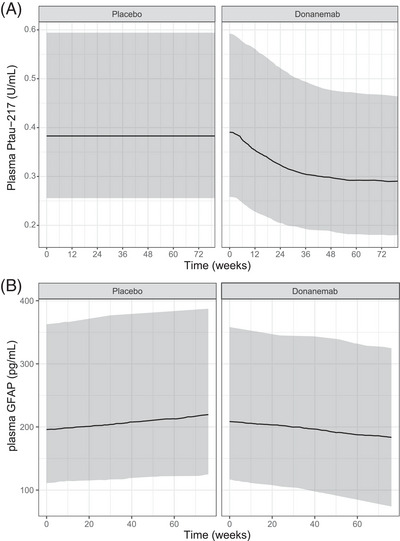
FIGURE 1.

Model‐predicted change in plasma biomarker concentration. Change from baseline simulated for plasma p‐tau217 (A) and plasma GFAP (B) levels with placebo and donanemab treatment. The shaded areas represent a 95% prediction interval. The lines represent the median prediction. Participants were simulated to follow the dosing treatment regimen as described in the Methods section. Actual participant titer time courses, weight, age, and baseline tau PET SUVR were sampled from the NONMEM dataset. GFAP, glial fibrillary acidic protein; NONMEM, nonlinear mixed effects modeling; PET, positron emission tomography; p–tau217, phosphorylated tau 217; SUVR, standarized uptake value ratio.
