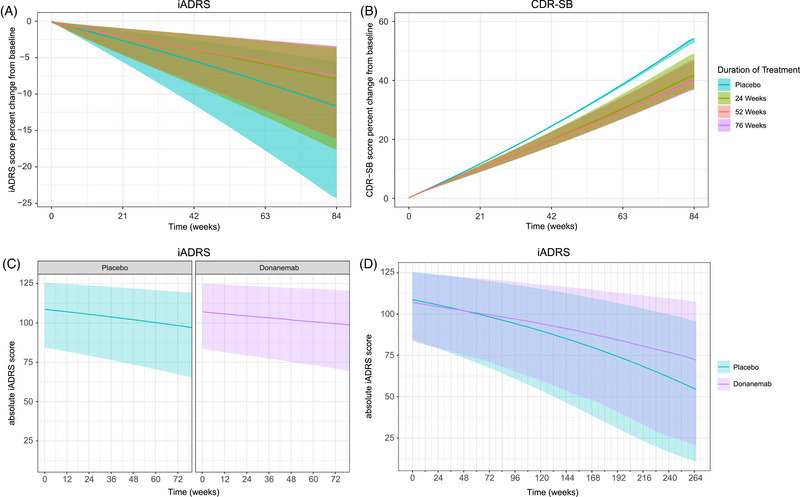
FIGURE 3.

Model‐predicted impact of duration of treatment on disease progression using amyloid level as a predictor of disease progression in APOE ε4 carriers. (A,B) Percent change from baseline in iADRS (A) or CDR‐SB (B) score based on duration of treatment using the disease‐progression model based on amyloid level. (C,D) Absolute iADRS score based on duration of treatment (76 weeks) (C) and simulation to 264 weeks using the disease‐progression model based on amyloid level (D). The y‐axis is plotted across a different range in panels A and B. The shaded areas represent a 95% prediction interval. The lines represent the median prediction. APOE ε4, apolipoprotein E ε4 allele; CDR‐SB, Clinical Dementia Rating‐Sum of Boxes; iADRS, Integrated Alzheimer's Disease Rating Scale.
