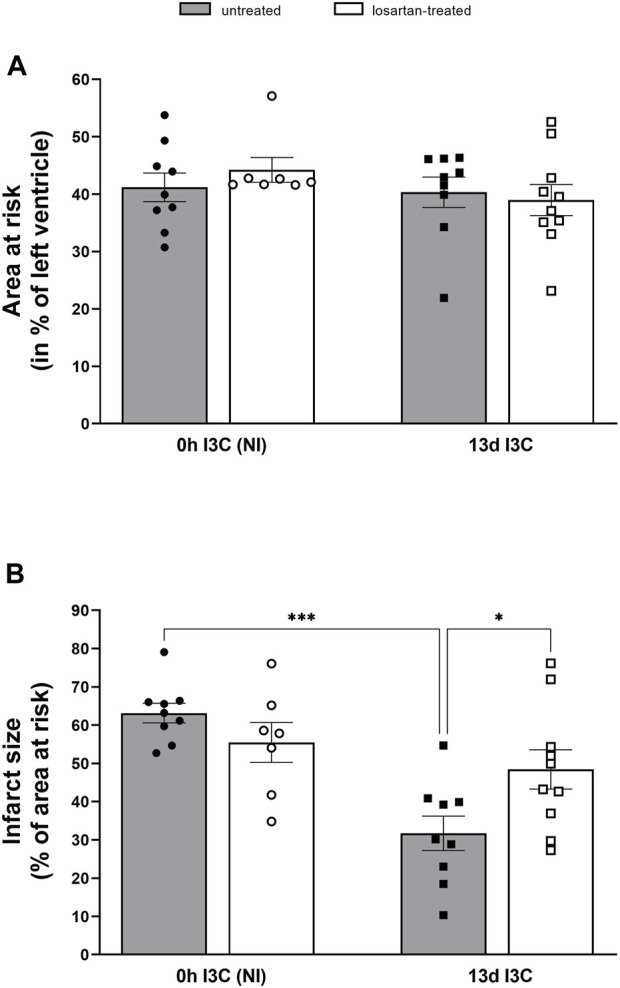
FIGURE 8.

Myocardial area at risk normalized to the size of the left heart ventricle (A) and infarct size presented as a percentage of the area at risk (B) in untreated and losartan-treated noninduced (NI) and I3C-induced Cyp1a1-Ren-2 transgenic rats. Values are expressed as means ± SEM. *p < 0.05, ***p < 0.001.
