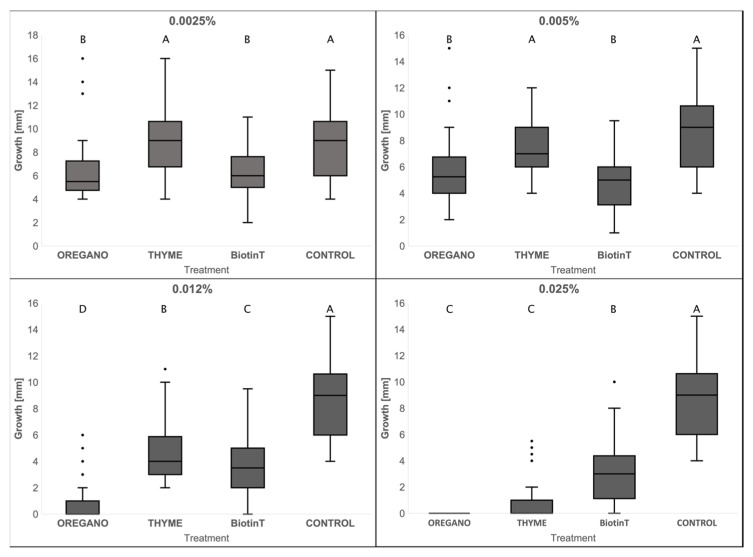
Figure 4.
Average colony sizes (mm) of the eight selected meristematic strains for each treatment with biocides. Capital letters above each dot plot represent the Tukey’s test results: the same letters correspond to comparable averages of treatments, different letters indicate averages of treatments significantly different from each other. The control (DMSO) is always represented by the letter A, which necessarily indicates the treatment with the least inhibitory effect; the subsequent letters result in an increasingly significant inhibitory activity.

