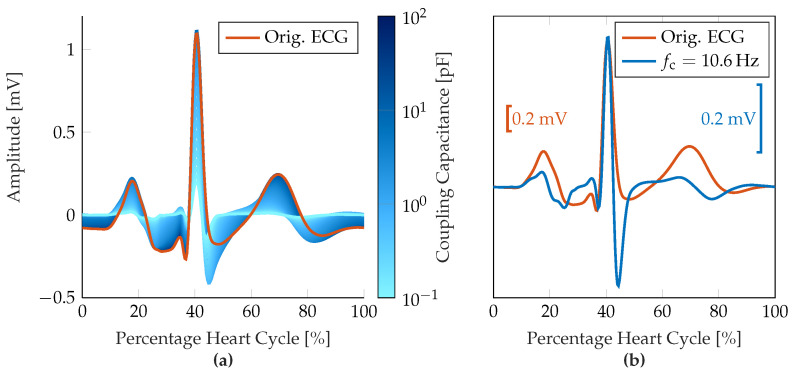
Figure 4.
Results of the measurement chain simulations. (a) Resulting changes in ECG signal morphology due to input high-pass filter characteristic over varying coupling capacity . Different coupling frequencies are represented by different shades of blue from to , the original ECG signal is shown in orange. (b) Comparison between original ECG signal morphology and amplitude-aligned filtered signal for the input high-pass characteristic with a cut-off frequency of .

