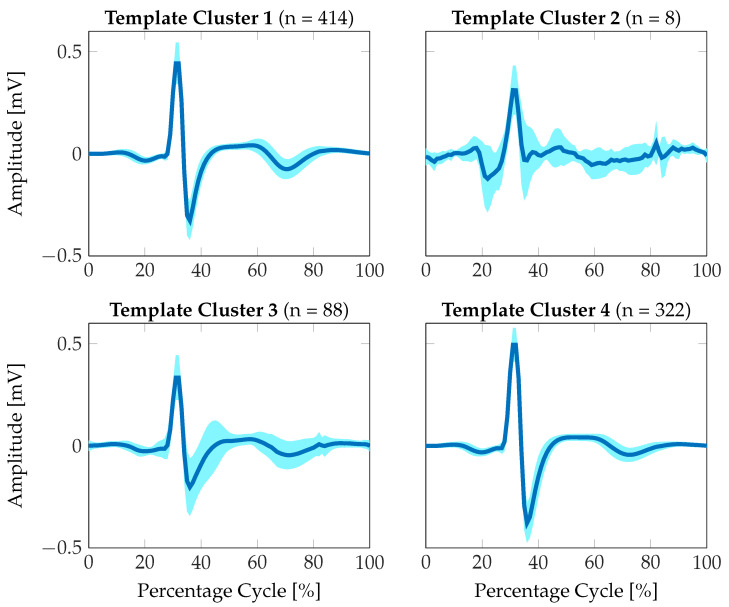
Figure 8.
ECG heart cycle prototypes extracted from the excellent´signal quality category. The signal prototypes were clustered into four separate groups according to maximum signal similarity using the DTW distance. The mean signal morphology is shown in dark blue, the standard deviation is represented by the light blue area.

