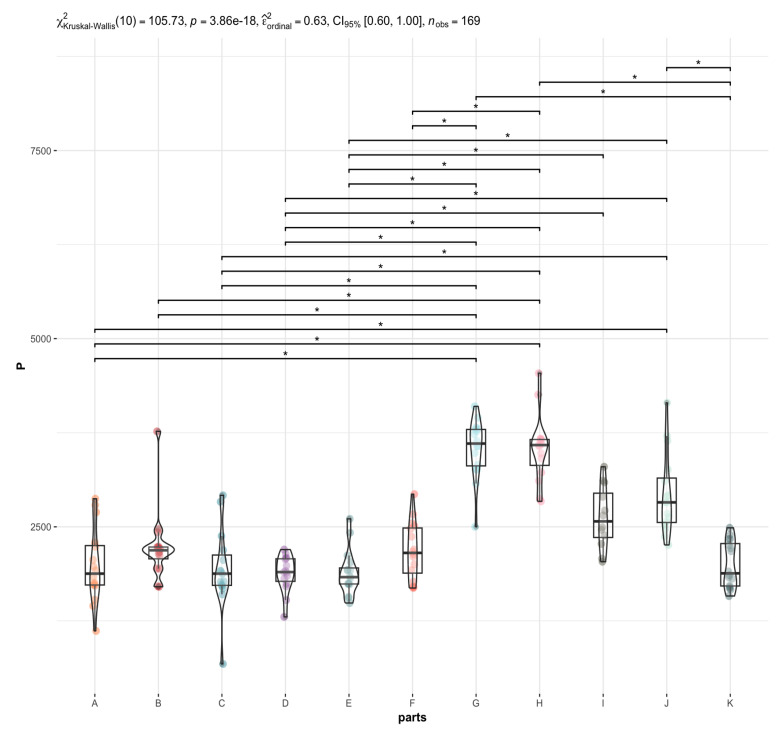
Figure 3.
Statistically significant differences in the P content in different brain areas (A to K) with the Kruskal-Wallis test results. The whiskers connect significantly different groups (pHolm-adj. = 0.03 − 7.36 × 10⁻⁷). An asterisk symbol (*) indicates statistically significant differences, p < 0.05.

