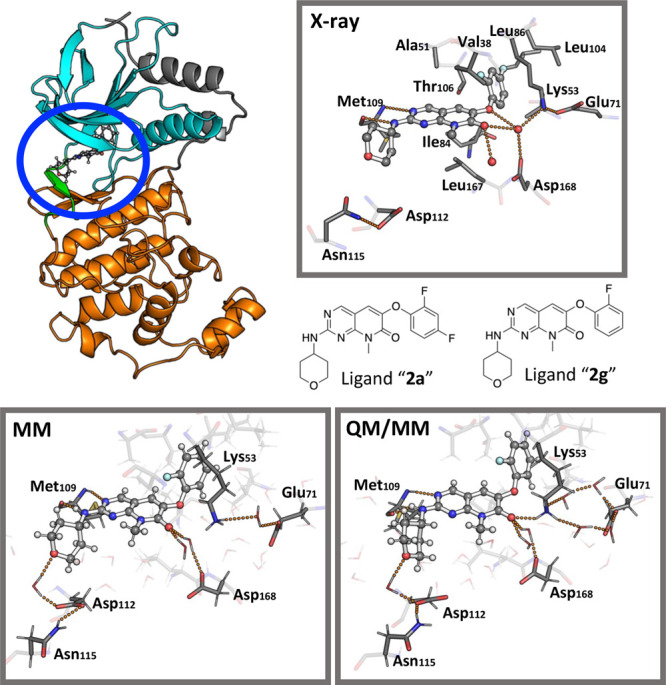
Figure 4.

Comparison of X-ray, MM, and MiMiC structures. Upper left panel: Cartoon representation of the p38α MAPK enzyme in complex with a ligand. The N-lobe (cyan) and the C-lobe (orange) of the enzyme are connected via a hinge region (green). The ligand binding pocket is located in between the lobes (blue ellipsis). Upper right panel: Representation of the enzyme binding pocket from the X-ray structure (PDB code: 3FLN).102 Ligand 2a is shown in a ball-and-stick representation, while the protein residues are shown as sticks. Crystal water molecules are shown as red spheres. H-bond interactions are shown as orange dotted lines. The structural formula of ligands 2a (X-ray) and 2g (MM and MiMiC simulations) is shown at the bottom of that panel. Lower left panel: Representative snapshot of the binding pocket from the classical MD simulation. Lower right panel: Representative snapshot of the binding pocket from MiMiC simulations.
