
Figure 6.
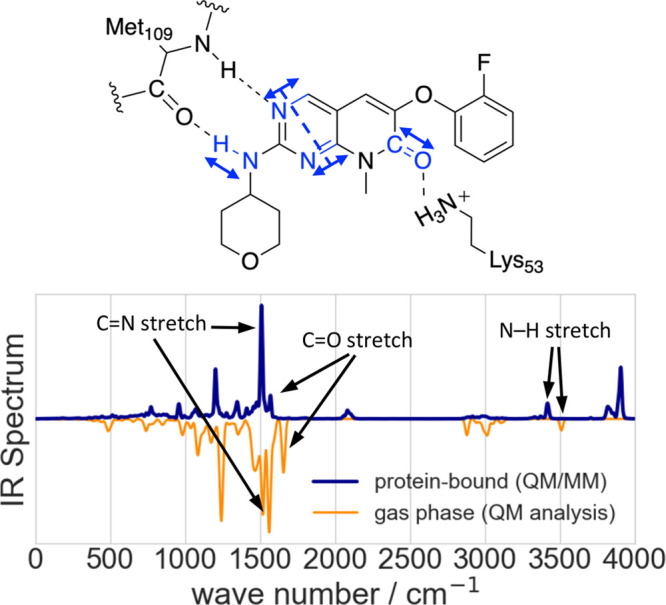
Vibrational analysis of the enzyme-bound ligand. Top panel: The scheme indicates important interactions of the ligand with the Met109 and Lys53 residues of p38α and vibrational modes of the ligand which are influenced by these interactions. Bottom panel: The IR spectrum of 2g bound to the p38α MAPK enzyme is shown in blue. The spectrum was obtained from a 14.52 ps-long QM/MM MD simulation, and the intensity normalized to its strongest absorption band. It is compared to a normalized spectrum of 2g (orange), which is determined from normal-mode analysis in the gas phase.