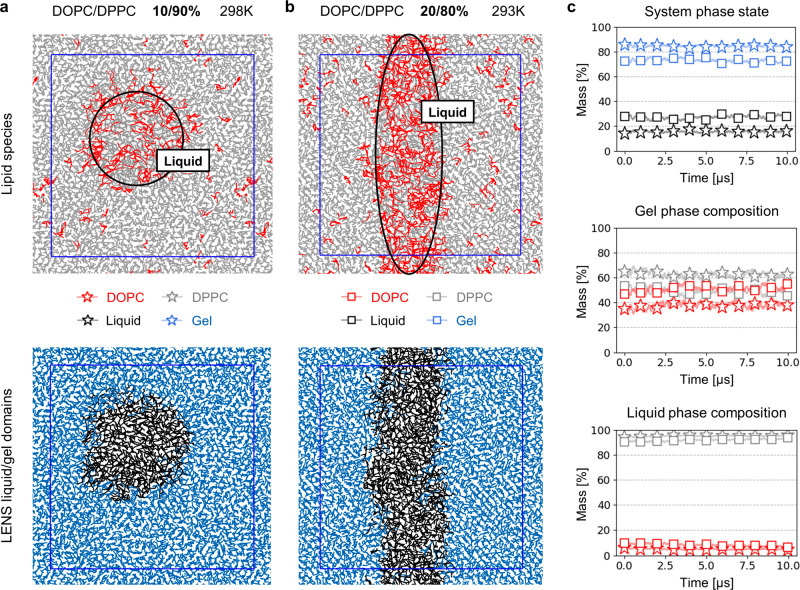
Figure 3.
Characterization of the phase separation in DOPC/DPPC mixtures with lipid models using Representation 1. (a) Orthogonal view of a bilayer composed of 1152 lipids at 10/90% mass of DOPC/DPPC. Top: colored according to lipid type (red, DOPC; gray, DPPC). Bottom: colored according to phase state using LENS (blue, gel phase; black, liquid phase). (b) Orthogonal view of a bilayer composed of 1152 lipids at 20/80% mass of DOPC/DPPC. Top: colored according to lipid type (red, DOPC; gray, DPPC). Bottom: colored according to phase state using LENS (blue, gel phase; black, liquid phase). (c) Top: mass percentage of the system in the gel (blue) and liquid (black) phase across simulations at 10% (stars) and 20% (squares) mass DOPC. Middle: mass percentage of DOPC (red) and DPPC (gray) found in the gel phase across simulations at 10% (stars) and 20% (squares) mass DOPC. Bottom: mass percentage of DOPC (red) and DPPC (gray) found in the liquid phase across simulations at 10% (stars) and 20% (squares) mass of DOPC.

