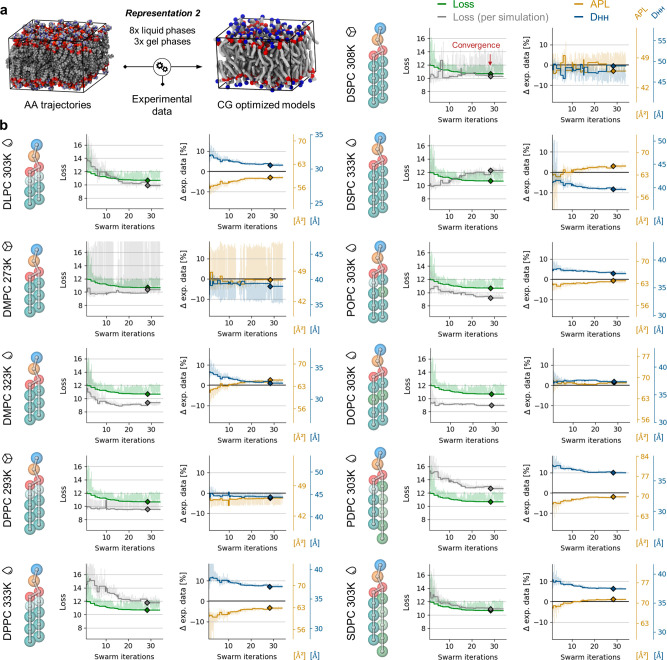
Figure 4.
Multiobjective optimization of the bonded parameters of the FF for PC lipid models built in the framework of Martini 3.0.0 using Representation 2 and in the training set bilayers of 8 different lipid types simulated at 11 temperatures (DLPC, 303 K; DMPC, 273 and 303 K; DPPC, 293 and 323 K; DSPC, 308 and 333 K; POPC, 303 K; DOPC, 303 K; PDPC 303 K; and SDPC 303 K). (a) Illustration summarizing the workflow. (b) Left panels: loss global (green) and loss per bilayer simulation (gray) in the training set. Right panels: APL (yellow) and DHH (blue) for each bilayer simulation in the training set. The horizontal black lines set at 0 identify the target experimental APL and DHH values. Solid curves are values corresponding to the best global loss at any point during optimization. Shaded lines show raw data. Diamonds represent values at convergence obtained with the optimized bonded parameters. The drop and box icons, respectively, represent the liquid and gel states of pure lipid bilayers at the corresponding temperatures.

