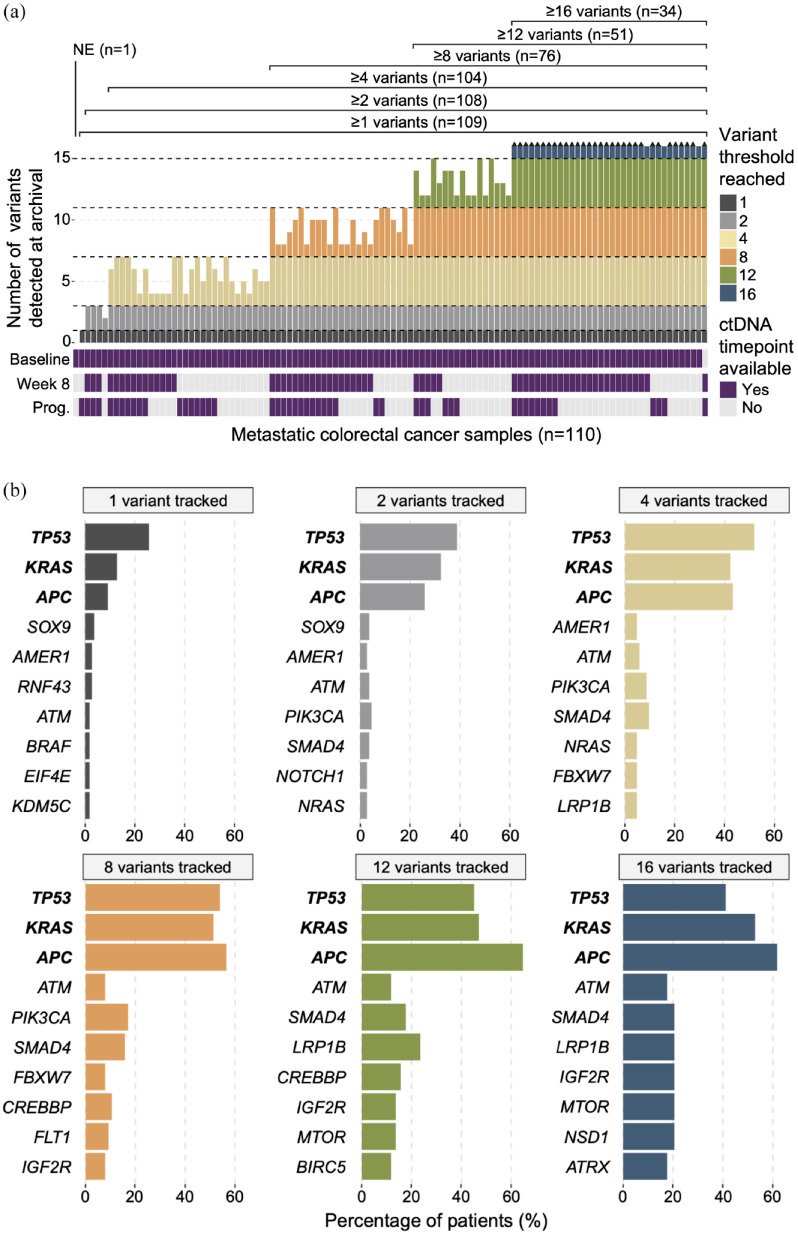
Figure 1.
Top clonal variants show recurrent patterns across mCRC samples. (a) Upper bar plot depicts the number of variants detected in each archival tissue sample, for variants affecting genes assayed by the subsequent ctDNA panel (n = 500 genes). Black arrowheads above bars indicate samples with more than 16 archival variants detected. Lower heatmap shows availability of subsequent ctDNA timepoints for each sample. (b) Bar plots illustrating genes most frequently affected by the top 1, 2, 4, 8, 12, and 16 variant pools (left to right) across all samples.

