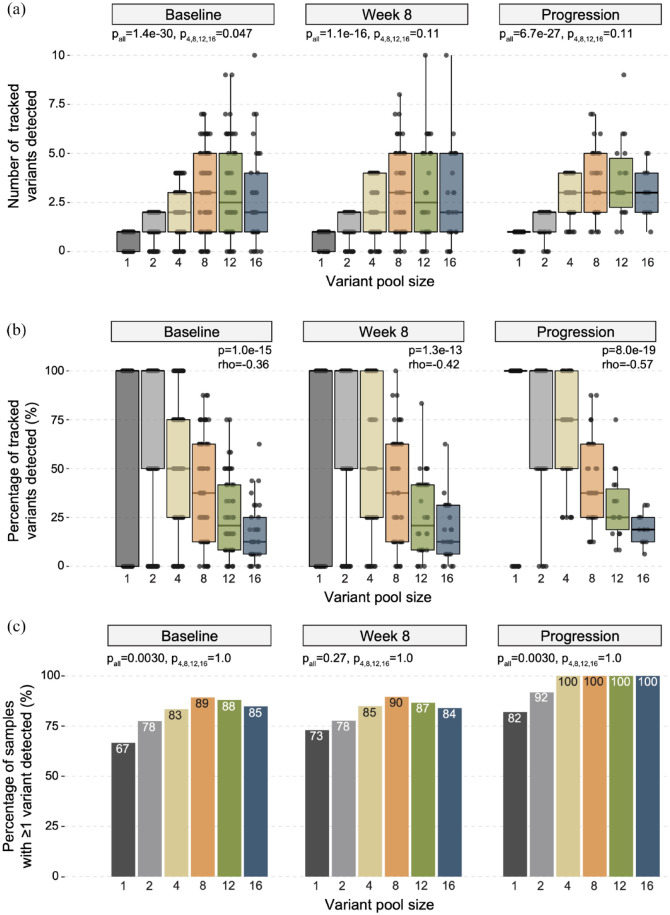
Figure 2.
Variant re-detection across increasing tracked variant pool sizes in each ctDNA timepoint. (a) Boxplots indicating the number of variants re-detected in ctDNA data when variant pool sizes 1, 2, 4, 8, 12, and 16 were used in baseline, week 8, and progression timepoints (left to right). Box-and-whiskers indicate median, 25 and 75% interquartile ranges are shown, along with one-way ANOVA p values for all variant pool sizes (pall) and variant pool sizes greater than or equal to 4 (p4,8,12,16). (b) Boxplots depicting the percentage of tracked variants re-detected across variant pool sizes for each ctDNA timepoint. Box-and-whiskers indicate median, 25 and 75% interquartile ranges and Spearman correlation p values and correlation coefficients (rho) are shown. (c) Bar plots showing the percentage of samples with at least one tracked variant re-detected for each variant pool size at each ctDNA timepoint, with percentage values shown at the top of each bar. Fisher’s exact test p values are shown for all variant pool sizes (pall) and variant pool sizes greater than or equal to 4 (p4,8,12,16).

