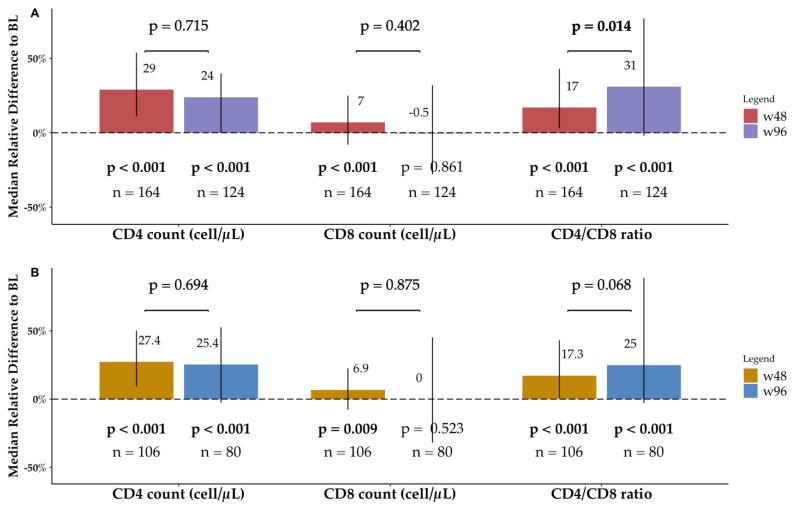
Figure 3.
Immune profile changes over time. The bars show the median relative difference from baseline (BL) for the considered immune parameters at both week 48 (w48) and week 96 (w96). The p-value shown under each bar comes from the paired Wilcoxon test between BL and the considered time-point; the p-value above-between the w48-bar and the w96-bar comes from the paired Wilcoxon test between w48 and w96. Vertical lines show the interquartile range. (A) Data from the overall BICTEL cohort. (B) Data only from PLWH older than 55 years.

