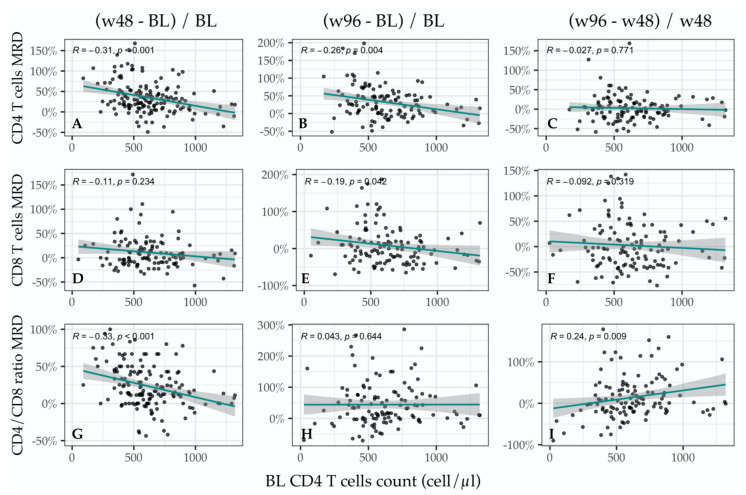
Figure 4.
Immune changes among time points as function of BL immune status. The figure visualizes the results of our linear regression model assessing the immune changes between time-points as function of the baseline (BL) immune status, [formula: median relative difference (MRD) = a + b*(BL CD4+ T cell count)]. The left column (A,D,G) shows the comparisons between BL and week 48 (w48); the middle column (B,E,H) shows the comparisons between week 96 (w96) and BL; the right column (C,F,I) shows the comparisons between w96 and w48. The upper row is relative to CD4+ T cells count; the middle row to CD8+ T cells count; the lower row is relative to CD4+/CD8+ ratio. The significant associations shown in (A,B,G,I) were confirmed at the multivariate analysis.

