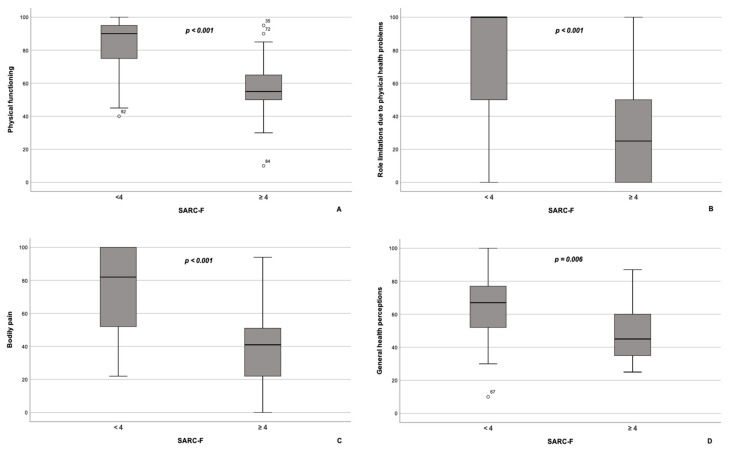
Figure 1.
Box plot of the subscales comprising the physical component summary of the SF-36 questionnaire for patients with NAFLD with (n = 17) and without sarcopenia (n = 91). Patients with NAFLD and sarcopenia had significantly lower scores on physical functioning (A), role limitations due to physical health problems (B), bodily pain (C), and general health perceptions (D) subscales compared to patients with NAFLD without sarcopenia. The line through the middle of each box represents the median. The length of the box, thus, represents the interquartile range. The error bars show the minimum and maximum values of each subscale. Outliers are depicted as circles. All comparisons are performed using Mann–Whitney U test.

