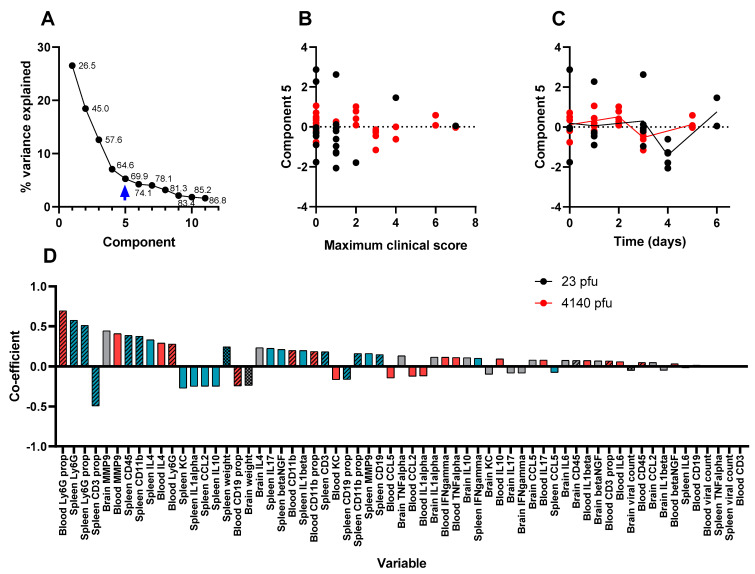
Figure 9.
The fifth component in a PCA of time course data from Balb/c mice infected with () or () VEEV TrD via the subcutaneous route. Animals were culled at time points, and multiple measurements were taken. Panel (A) shows the scree plot indicating the proportion of the dataset (including the data from all parameters) that can be described by each component (an amalgam of some of each parameter) calculated by the analysis. These data are shown either as a line (the proportion explained by the component) or as a data label (the cumulative proportion). An arrow has been added to indicate which component is characterised further in this figure (i.e., component 5 in this figure). Panel (B) shows the regression-derived value for this component for each mouse, relative to the maximum clinical score prior to cull. Each data point is from a single mouse. Panel (C) shows the regression-derived value for this component, for each mouse, relative to time post-challenge at point of cull. Each data point is from a single mouse with a line added to indicate the mean for each cull point. Panel (D) shows the coefficients, in order of absolute scale, of each variable that contributes to this component. Measurements of viral titre/body weight, cytokines, and flow cytometry are individually assigned in blood (red), spleen (blue), and brain (grey). These measurements are further divided by viral titre and animal weight (checkerboard), flow cytometry (crosshatched), and cytokine (plain).

